Office Depot 2001 Annual Report Download - page 26
Download and view the complete annual report
Please find page 26 of the 2001 Office Depot annual report below. You can navigate through the pages in the report by either clicking on the pages listed below, or by using the keyword search tool below to find specific information within the annual report.-
 1
1 -
2
-
3
-
4
-
5
-
6
-
7
-
8
-
9
-
10
-
11
-
12
-
13
-
14
-
15
-
 16
16 -
 17
17 -
 18
18 -
 19
19 -
 20
20 -
 21
21 -
 22
22 -
 23
23 -
 24
24 -
 25
25 -
 26
26 -
 27
27 -
 28
28 -
 29
29 -
 30
30 -
 31
31 -
 32
32 -
 33
33 -
 34
34 -
 35
35 -
 36
36 -
37
-
38
-
39
-
40
-
41
-
42
-
43
-
44
-
45
-
46
-
47
-
48
-
49
-
50
-
51
-
52
-
53
-
54
-
55
-
56
 |
 |

24
Office Depot, Inc.
Management’s Discussion and Analysis of Financial Condition and Results of Operations(continued)
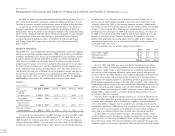
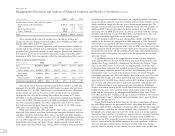
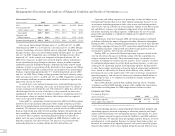
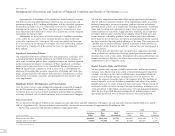
International Division
(Dollars in millions) 2001 2000 1999
Sales $1,552.0 100.0% $1,467.4 100.0% $1,325.4 100.0%
Cost of goods sold
and occupancy costs 932.3 60.1% 890.0 60.7% 788.3 59.5%
Gross profit 619.7 39.9% 577.4 39.3% 537.1 40.5%
Operating and
selling expenses 400.3 25.8% 398.5 27.1% 373.6 28.2%
Segment operating profit $ 219.4 14.1% $ 178.9 12.2% $ 163.5 12.3%
Sales in our International Division grew 6% in 2001 and 11% in 2000.
Adjusting fiscal 2000 to a 52-week basis, sales increased 8% in 2001. Foreign
currency translations adversely affected sales in all periods. Excluding the
foreign currency effect, sales in our International Division grew 11% in 2001
and 23% in 2000. Comparable sales, excluding the foreign currency effect,
increased 12% in the current year compared with growth of over 30% in
2000. These increases in 2001 were achieved despite softness experienced
in our operations in larger European countries relating to softer economic
conditions generally throughout Europe. Although the Office Depottbrand
continues to grow as a percentage of the total sales in this segment, our Viking
Office Productstbrand still accounts for the vast majority of our international
business, representing approximately 87% of all international sales in 2001
and 88% in 2000. These Viking catalog operations had local currency compa-
rable sales increases of 11% in 2001 and 16% in 2000. Competitive, political,
and economic conditions in international markets in which we operate may
impact our sales in the future.
As noted above, sales in local currencies have substantially increased in
recent years. For U.S. reporting, these sales are translated into U.S. dollars at
average exchange rates during the year. The strong U.S. dollar has adversely
affected reported sales in each of the three years presented, in some cases
significantly. To the extent the U.S. dollar continues to strengthen relative to
the currencies where we conduct business, this adverse effect on reported
sales can be expected to continue.
Gross profit as a percentage of sales increased in 2001 and reflects pricing
initiatives in certain machine and general office supply categories, partially
offset by the introduction of our lower-margin contract sales in certain European
countries. The decrease in gross profit as a percent of sales in 2000 resulted
from an unfavorable mix shift towards machine supplies, primarily ink and
toner cartridges, which yield lower gross profit margins than other products.
As with our other segments, our International Division was affected by
higher costs for paper and machine supplies in 2000. However, unlike our
domestic segments, the effect of these cost increases was lessened with
increased pricing in our catalogs during the latter half of the year.
Operating and selling expenses as a percentage of sales are higher in our
International Division than in our other segments primarily because we use
an extensive marketing program to drive sales in new and existing markets,
and we have start-up activities in several markets. Similar to our BSG, person-
nel and delivery expenses are significant components of our International
Division’s operating and selling expenses. Additionally, the cost of catalog
preparation and mailing is a significant component to support the direct
mail channel.
Continuing a trend that began in 2000, advertising expenses continued
to decline, reflecting the impact of improved mailing efficiencies throughout
Europe in 2001, as well as continued improvement in our use of more effective
advertising campaigns in Japan. In 1999, increasing competition in many of
our established markets, coupled with our efforts to gain market share in
certain newer markets, drove up our advertising costs.
During 2001, we incurred additional operating expenses related to the
start up of contract businesses in Europe along with the acquisition of a
contract stationer in Australia. These incremental costs are normal as we
continue developing our business in new markets. These expenses are offset
by continuing improvement in certain fixed operating expenses. As our oper-
ations grow in a particular market, fixed operating expenses decline relative
to sales. For example, advertising costs in the form of prospecting and delivery
costs, which are affected by the density of the delivery areas, decline as a
percentage of sales as the market grows. We expect to leverage certain fixed
operating expenses, and our cost to attract new customers should decline as
a percentage of sales as we continue to establish our brands and grow our
international business.
Fiscal 2001 includes a gain of $10.2 million from the sale of a London
warehouse and fiscal 2000 includes charges of $5.3 million for closed stores
and facilities resulting from the 2000 comprehensive business review.
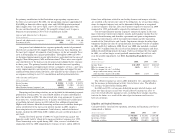
Corporate and Other
Pre-opening Expenses
(Dollars in thousands) 2001 2000 1999
Pre-opening expenses $10,172 $13,465 $23,628
Office supply stores opened* 55 78 159
* Includes domestic and wholly-owned international openings and relocations.
Our pre-opening expenses consist principally of personnel, property and
advertising expenses incurred in opening or relocating stores in our North
American Retail Division. Our pre-opening expenses also include, to a lesser
extent, expenses incurred to open or relocate facilities in our BSG and Inter-
national Division. We typically incur pre-opening expenses during a six-week
period prior to a store opening. Because we expense these items as they are
incurred, the amount of pre-opening expenses each year is generally propor-
tional to the number of new stores opened during the period. This has been