OG&E 2014 Annual Report Download - page 9
Download and view the complete annual report
Please find page 9 of the 2014 OG&E annual report below. You can navigate through the pages in the report by either clicking on the pages listed below, or by using the keyword search tool below to find specific information within the annual report.-
 1
1 -
 2
2 -
 3
3 -
 4
4 -
 5
5 -
 6
6 -
 7
7 -
 8
8 -
 9
9 -
 10
10 -
 11
11 -
 12
12 -
 13
13 -
 14
14 -
 15
15 -
 16
16 -
 17
17 -
 18
18 -
 19
19 -
 20
20 -
21
-
22
-
23
-
24
-
25
-
26
-
27
-
28
-
29
-
30
-
31
-
32
-
33
-
34
-
35
-
36
-
37
 |
 |

14 OGE Energy Corp. OGE Energy Corp. 15
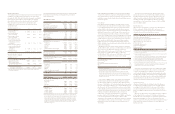
Results of Operations
The following discussion and analysis presents factors that affected the
Company’s consolidated results of operations for the years ended
December 31, 2014, 2013 and 2012 and the Company’s consolidated
financial position at December 31, 2014 and 2013. The following
information should be read in conjunction with the Consolidated
Financial Statements and Notes thereto. Known trends and
contingencies of a material nature are discussed to the extent
considered relevant.
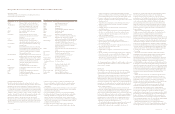
Year ended December 31
(In millions except per share data) 2014 2013 2012
Net income attributable
to OGE Energy $ 395.8 $ 387.6 $ 355.0
Basic average common
shares outstanding 199.2 198.2 197.1
Diluted average common
shares outstanding 199.9 199.4 198.1
Basic earnings per average
common share attributable
to OGE Energy common
shareholders $ 1.99 $ 1.96 $ 1.80
Diluted earnings per average
common share attributable
to OGE Energy common
shareholders $ 1.98 $ 1.94 $ 1.79
Dividends declared
per common share $0.95000 $0.85125 $0.79750
Results by Business Segment
Year ended December 31
(In millions) 2014 2013 2012
Net Income attributable to OGE Energy
OG&E (Electric Utility) $292.0 $292.6 $280.3
OGE Holdings (Natural
Gas Midstream Operations) 102.3 99.9 74.1
Other Operations (A) 1.5 (4.9) 0.6
Consolidated net income
attributable to OGE Energy $395.8 $387.6 $355.0
(A) Other Operations primarily includes the operations of the holding company and
consolidating eliminations.
The following operating results analysis by business segment includes
intercompany transactions that are eliminated in the Consolidated
Financial Statements.
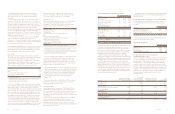
OG&E (Electric Utility)
Year ended December 31 (Dollars in millions) 2014 2013 2012
Operating revenues $2,453.1 $2,262.2 $2,141.2
Cost of sales 1,106.6 965.9 879.1
Other operation and maintenance 453.2 438.8 446.3
Depreciation and amortization 270.8 248.4 248.7
Taxes other than income 84.5 83.8 77.7
Operating income 538.0 525.3 489.4
Allowance for equity funds used
during construction 4.2 6.6 6.2
Other income 4.8 8.1 8.2
Other expense 1.9 4.6 4.3
Interest expense 141.5 129.3 124.6
Income tax expense 111.6 113.5 94.6
Net income $ 292.0 $ 292.6 $ 280.3
Operating revenues by classification
Residential $ 925.5 $ 901.4 $ 878.0
Commercial 583.3 554.2 523.5
Industrial 224.5 220.6 206.8
Oilfield 188.3 176.4 163.4
Public authorities and street light 220.3 214.3 202.4
Sales for resale 52.9 59.4 54.9
System sales revenues 2,194.8 2,126.3 2,029.0
Off-system sales revenues 94.1 14.7 36.5
Other 164.2 121.2 75.7
Total operating revenues $2,453.1 $2,262.2 $2,141.2
Reconciliation of gross margin to revenue:
Operating revenues $2,453.1 $2,262.2 $2,141.2
Cost of sales 1,106.6 965.9 879.1
Gross margin $1,346.5 $1,296.3 $1,262.1
MWH sales by classification (in millions)
Residential 9.4 9.4 9.1
Commercial 7.2 7.1 7.0
Industrial 3.8 3.9 4.0
Oilfield 3.4 3.4 3.3
Public authorities and street light 3.2 3.2 3.3
Sales for resale 1.0 1.2 1.3
System sales 28.0 28.2 28.0
Off-system sales 2.2 0.4 1.4
Total sales 30.2 28.6 29.4
Number of customers 814,982 806,940 798,110
Weighted-average cost of energy
per kilowatt-hour-cents
Natural gas 4.506 3.905 2.930
Coal 2.152 2.273 2.310
Total fuel 2.752 2.784 2.437
Total fuel and purchased power 3.493 3.178 2.806
Degree days(A)
Heating – Actual 3,569 3,673 2,667
Heating – Normal 3,349 3,349 3,349
Cooling – Actual 2,114 2,106 2,561
Cooling – Normal 2,092 2,092 2,092
(A)
Degree days are calculated as follows: The high and low degrees of a particular day
are added together and then averaged. If the calculated average is above 65 degrees,
then the difference between the calculated average and 65 is expressed as cooling
degree days, with each degree of difference equaling one cooling degree day. If the
calculated average is below 65 degrees, then the difference between the calculated
average and 65 is expressed as heating degree days, with each degree of difference
equaling one heating degree day. The daily calculations are then totaled for the
particular reporting period.
2014 compared to 2013. OG&E’s net income decreased 0.6 million,
or 0.2 percent, in 2014 as compared to 2013 primarily due to higher
gross margin, which was almost offset by higher other operations and
maintenance expense, higher depreciation and amortization expense,
and interest expense.
Gross Margin
Gross Margin is defined by OG&E as operating revenues less fuel,
purchased power and certain transmission expenses. Gross margin
is a non-GAAP financial measure because it excludes depreciation
and amortization, and other operation and maintenance expenses.
Expenses for fuel and purchased power are recovered through fuel
adjustment clauses and as a result changes in these expenses are
offset in operating revenues with no impact on net income. OG&E
believes gross margin provides a more meaningful basis for evaluating
its operations across periods than operating revenues because gross
margin excludes the revenue effect of fluctuations in these expenses.
Gross margin is used internally to measure performance against
budget and in reports for management and the Board of Directors.
OG&E’s definition of gross margin may be different from similar terms
used by other companies.
Operating revenues were $2,453.1 million in 2014 as compared to
$2,262.2 million in 2013, an increase of $190.9 million, or 8.4 percent.
Cost of sales were $1,106.6 million in 2014 as compared to
$965.9 million in 2013, an increase of $140.7 million, or 14.6 percent.
Gross margin was $1,346.5 million in 2014 as compared to
$1,296.3 million in 2013, an increase of $50.2 million, or 3.9 percent.
The below factors contributed to the change in gross margin:
(In millions) $ Change
Wholesale transmission revenue (A) $ 43.8
New customer growth 13.8
Price variance (B) 6.8
Non-residential demand and related revenues 1.4
Other (1.7)
Quantity variance (primarily weather) (13.9)
Change in gross margin $ 50.2
(A) Increased primarily due to higher investments related to certain FERC approved
transmission projects included in formula rates.
(B) Increased due to higher rider revenues primarily from the Oklahoma Demand
Program rider, the Oklahoma Storm Recovery rider and the Arkansas Demand
Program rider partially offset by lower rider revenues from the Oklahoma Crossroads
rider, Oklahoma Smart Grid rider, Oklahoma System Hardening rider and the
Arkansas Crossroads rider.
Cost of sales for OG&E consists of fuel used in electric generation,
purchased power and transmission related charges. Fuel expense
was $627.5 million in 2014 as compared to $672.7 million in 2013, a
decrease of $45.2 million, or 6.7 percent, primarily due to lower natural
gas used offset by higher natural gas prices. In 2014, OG&E’s fuel mix
was 61 percent coal, 32 percent natural gas and seven percent wind.
In 2013, OG&E’s fuel mix was 53 percent coal, 40 percent natural gas
and seven percent wind. Purchased power costs were $444.1 million
in 2014 as compared to $267.6 million in 2013, an increase of
$176.5 million, or 66.0 percent, primarily due to an increase in
purchases from the SPP, reflecting the impact of OG&E’s participation
in the SPP Integrated Market, which began on March 1, 2014.
Transmission related charges were $35.0 million in 2014 as compared
to $25.6 million in 2013, an increase of $9.4 million, or 36.7 percent,
primarily due to higher SPP charges for the base plan projects of
other utilities.
The actual cost of fuel used in electric generation and certain
purchased power costs are passed through to OG&E’s customers
through fuel adjustment clauses. The fuel adjustment clauses are
subject to periodic review by the OCC, the APSC and the FERC.
The OCC, the APSC and the FERC have authority to review the
appropriateness of gas transportation charges or other fees OG&E
pays to its affiliate, Enable.
Operating Expenses
Other operation and maintenance expenses were $453.2 million in
2014 as compared to $438.8 million in 2013, an increase of
$14.4 million, or 3.3 percent. The below factors contributed to the
change in other operations and maintenance expense:
(In millions) $ Change
Reduction in capitalized labor (A) $11.4
Corporate overhead and allocations (B) 4.0
Contract professional services (primarily marketing services) 3.8
Ongoing maintenance at power plants 3.5
Other marketing, sales and commercial (C) 2.3
Software expense (D) 2.3
Fees, permits and licenses (E) 2.3
Vegetation management (F) (4.5)
Employee benefits (G) (4.9)
Salaries and wages (H) (5.8)
Change in other operation and maintenance expense $14.4
(A) Portion of labor costs capitalized into projects decreased as a result of less work
performed on storm restoration.
(B) Increased primarily due to higher allocated costs from the holding company resulting
from the formation of Enable during 2013.
(C) Increased primarily due to demand side management customer payments which are
recovered through a rider partially offset by a reduction in media services expense.
(D) Increased as a result of higher expenditures related to Smart Grid software.
(E) Increased primarily due to higher SPP administration and assessment fees.
(F) Decreased primarily due to increased spending on system hardening in 2013 which
includes costs that are being recovered through a rider.
(G) Decreased primarily due to lower pension expense, postretirement and other benefits.
(H) Decreased primarily due to incentive compensation and lower overtime wages
partially offset by higher regular salaries and wages.
Depreciation and amortization expense was $270.8 million in 2014
as compared to $248.4 million in 2013, an increase of $22.4 million,
or 9.0 percent, primarily due to additional assets being placed in
service primarily related to transmission lines being placed in service
throughout 2013 and 2014, along with an increase resulting from the
amortization of the deferred pension credits regulatory liability which
was fully amortized in July 2014. These were offset by the pension
regulatory asset which was fully amortized in July 2013.
Additional Information
Allowance for Equity Funds Used During Construction. Allowance
for equity funds used during construction was $4.2 million in 2014
as compared to $6.6 million in 2013, a decrease of $2.4 million or
36.4 percent, primarily due to lower construction work in progress
balances resulting from transmission projects being placed in service
in 2014.
Other Income. Other income was $4.8 million in 2014 as compared
to $8.1 million in 2013, a decrease of $3.3 million or 40.7 percent,
primarily due to decreased margins recognized in the guaranteed flat
bill program during 2014 as a result of cooler weather in the first
quarter as compared to the same period in 2013 along with a decrease
in the tax gross up related to the allowance for equity funds used
during construction.