OG&E 2014 Annual Report Download - page 18
Download and view the complete annual report
Please find page 18 of the 2014 OG&E annual report below. You can navigate through the pages in the report by either clicking on the pages listed below, or by using the keyword search tool below to find specific information within the annual report.-
 1
1 -
2
-
3
-
4
-
5
-
6
-
7
-
 8
8 -
 9
9 -
 10
10 -
 11
11 -
 12
12 -
 13
13 -
 14
14 -
 15
15 -
 16
16 -
 17
17 -
 18
18 -
 19
19 -
 20
20 -
 21
21 -
 22
22 -
 23
23 -
 24
24 -
 25
25 -
 26
26 -
 27
27 -
 28
28 -
29
-
30
-
31
-
32
-
33
-
34
-
35
-
36
-
37
 |
 |

32 OGE Energy Corp. OGE Energy Corp. 33
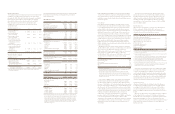
Consolidated Statements of Comprehensive Income
Year ended December 31 (In millions) 2014 2013 2012
Net income $395.8 $393.8 $385.0
Other comprehensive income (loss), net of tax
Pension Plan and Restoration Income Plan:
Amortization of deferred net loss, net of tax of $1.2, $2.4 and $1.7, respectively 1.8 3.7 3.0
Net gain (loss) arising during the period, net of tax of ($7.0), $7.8 and ($5.6), respectively (11.1) 12.4 (10.2)
Amortization of prior service cost, net of tax of $0, $0 and $0.2, respectively — — 0.2
Settlement (Curtailment) cost, net of tax of ($0.1), $1.9 and $0, respectively (0.1) 3.0 —
Postretirement Benefit Plans:
Amortization of deferred net loss, net of tax of $0.5, $1.3 and ($1.1), respectively 0.9 2.0 2.0
Net gain (loss) arising during the period, net of tax of ($1.9), $4.4 and ($1.1), respectively (3.1) 6.9 (2.3)
Amortization of deferred net transition obligation, net of tax of $0, $0 and $0.1, respectively — — 0.1
Amortization of prior service cost, net of tax of ($1.1), ($1.1) and ($1.0), respectively (1.8) (1.8) (1.8)
Deferred commodity contracts hedging (gains) losses reclassified in net income, net of tax of
$0, $0.4 and ($1.6), respectively — 0.6 (3.6)
Deferred commodity contracts hedging gains (losses), net of tax of $0, $0
and $0.1, respectively — — 0.4
Amortization of deferred interest rate swap hedging losses, net of tax of $0.1, $0.1
and $0.2, respectively 0.2 0.3 0.2
Other comprehensive income, net of tax (13.2) 27.1 (12.0)
Comprehensive income 382.6 420.9 373.0
Less: Comprehensive income attributable to noncontrolling interest — 6.3 26.5
Less: Deconsolidation of Enogex Holdings — 6.1 —
Total comprehensive income attributable to OGE Energy $382.6 $408.5 $346.5
The accompanying Notes to Consolidated Financial Statements are an integral part hereof.
Consolidated Statements of Cash Flows
Year ended December 31 (In millions) 2014 2013 2012
Cash Flows from Operating Activities
Net income $ 395.8 $ 393.8 $ 385.0
Adjustments to reconcile net income to net cash provided from operating activities
Depreciation and amortization 281.4 298.6 375.2
Deferred income taxes and investment tax credits, net 177.3 125.9 143.7
Equity in earnings of unconsolidated affiliates (172.6) (101.9) —
Distributions from unconsolidated affiliates 143.7 51.7 —
Allowance for equity funds used during construction (4.2) (6.6) (6.2)
(Gain) Loss on disposition of assets (0.2) (8.6) 4.2
Gain on insurance proceeds — — (7.5)
Stock-based compensation (2.7) (3.5) (2.6)
Regulatory assets 4.6 26.8 20.3
Regulatory liabilities (4.4) (32.5) (14.8)
Other assets (16.3) 1.3 (6.9)
Other liabilities 29.6 (7.0) (14.3)
Change in certain current assets and liabilities
Accounts receivable, net (9.4) (34.0) 27.1
Accounts receivable – unconsolidated affiliates 6.8 3.7 —
Accrued unbilled revenues 3.2 (1.3) 1.9
Income taxes receivable (10.4) 1.6 1.1
Fuel, materials and supplies inventories 20.4 5.1 13.7
Fuel clause under recoveries (42.1) (26.2) 1.8
Other current assets (2.7) (4.5) (8.6)
Accounts payable (64.0) 56.9 25.1
Fuel clause over recoveries (0.4) (108.8) 101.5
Other current liabilities (11.8) (7.3) 6.4
Net Cash Provided from Operating Activities 721.6 623.2 1,046.1
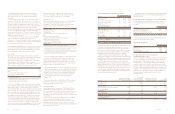
Cash Flows from Investing Activities
Capital expenditures (less allowance for equity funds used during construction) (569.3) (990.6) (1,150.6)
Return of capital – Equity method investments 9.5 — —
Proceeds from sale of assets 0.7 36.3 1.5
Investment in unconsolidated affiliates — (2.7) —
Acquisition of gathering assets — — (78.6)
Proceeds from insurance — — 7.6
Reimbursement of capital expenditures — — 27.5
Net Cash Used in Investing Activities (559.1) (957.0) (1,192.6)
Cash Flows from Financing Activities
Proceeds from long-term debt 588.9 247.4 250.0
Issuance of common stock 13.2 14.2 14.3
Dividends paid on common stock (184.1) (165.5) (154.5)
Payment of long-term debt (240.2) (0.1) (0.1)
(Decrease) increase in short-term debt (341.6) 8.7 153.8
Changes in advances with unconsolidated affiliates — 129.6 —
Contributions from noncontrolling interest partners — 107.0 46.2
Repayment of line of credit — — (150.0)
Purchase of treasury stock — — (3.4)
Distributions to noncontrolling interest partners — (2.5) (12.6)
Net Cash (Used in) Provided from Financing Activities (163.8) 338.8 143.7
Net Increase (Decrease) in Cash and Cash Equivalents (1.3) 5.0 (2.8)
Cash and Cash Equivalents at Beginning of Period 6.8 1.8 4.6
Cash and Cash Equivalents at End of Period $ 5.5 $ 6.8 $ 1.8
The accompanying Notes to Consolidated Financial Statements are an integral part hereof.