OG&E 2014 Annual Report Download - page 11
Download and view the complete annual report
Please find page 11 of the 2014 OG&E annual report below. You can navigate through the pages in the report by either clicking on the pages listed below, or by using the keyword search tool below to find specific information within the annual report.-
 1
1 -
 2
2 -
 3
3 -
 4
4 -
 5
5 -
 6
6 -
 7
7 -
 8
8 -
 9
9 -
 10
10 -
 11
11 -
 12
12 -
 13
13 -
 14
14 -
 15
15 -
 16
16 -
 17
17 -
 18
18 -
 19
19 -
 20
20 -
 21
21 -
 22
22 -
23
-
24
-
25
-
26
-
27
-
28
-
29
-
30
-
31
-
32
-
33
-
34
-
35
-
36
-
37
 |
 |

18 OGE Energy Corp. OGE Energy Corp. 19
OGE Holding’s net income decreased $4.2 million, or 4 percent for
the year ended December 31, 2014 as compared to the same period
of 2013 due to higher pre-tax income and higher tax expense. OGE
Holding’s earnings before taxes increased $38.0 million, or
28.5 percent, for the year ended December 31, 2014 as compared to
the same period of 2013. The increase reflects the accretive effect to
OGE Holdings of Enable, for the entire year of 2014, as compared to
only eight months of 2013, following the formation of Enable on May 1,
2013. Enable’s operating results for 2014 improved as compared to
2013, due to increased gathering and processing margins as a result
of higher processed volumes in the Anadarko and Ark-La-Tex basins
(which offset lower gathering volumes) and higher crude oil gathering
margins. Additionally, Enable’s operating results for 2014 improved as
compared to 2013 due to higher transportation and storage margins as
a result of an increase of unrealized gains on natural gas derivatives
and an increase of system optimization activities. The higher margins
were offset in part, by higher depreciation expenses resulting from
assets being placed in service and higher operating and maintenance
expenses. Finally, as a result of Enable’s initial public offering in
April 2014, and CenterPoint’s exercising of its put right to Enable, for its
24.95 percent interest in SESH, OGE Energy’s ownership in Enable
dropped from 28.5 percent at the beginning of 2014 to 26.3 percent by
the end of 2014, further partially offsetting the increase in earnings
before taxes.
Income Tax Expense. Income tax expense was $69.1 million in 2014
as compared to $26.9 million in 2013, an increase of $42.2 million
primarily due to higher pre-tax income and higher tax expense as
compared to the prior period due to the absence of favorable deferred
tax adjustments related to the formation of Enable.
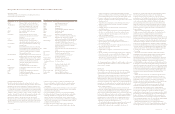
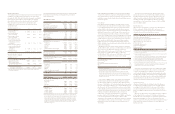
Operating Data
December 31,
2014 2013
Gathered volumes - TBtu/d 3.34 3.05
Transportation volumes - TBtu/d 4.95 4.41
Natural gas processed volumes - TBtu/d 1.56 1.09
NGLs sold - million gallons/d (A)(B) 68.67 44.91
(A) Excludes condensate.
(B) NGLs sold includes volumes of NGLs withdrawn from inventory or purchased for
system balancing purposes.
Year Ended December 31, 2013 as Compared to
Year Ended December 31, 2012
OGE Holdings’ net income for the four months ended April 2013 as
compared to the same period of 2012 decreased $18.7 million
primarily due to a $45.4 million reduction in operating income reflecting
lower NGLs prices, lower keep-whole processing spreads and the
contract conversion of the Texas production volumes of one of Enogex
LLC’s five largest customers from keep-whole to fixed-fee, and to a
lesser extent, slightly higher other operation and maintenance expense
and depreciation and amortization expense. These decreases were
partially offset by increased gathering rates and volumes and inlet
processing volumes associated with ongoing Enogex LLC expansion
projects and the gas gathering assets acquired in August 2012, and a
$9.9 million gain related to the sale of certain gas gathering assets in
the Texas panhandle in January 2013. Also offsetting the decrease
were $11.4 million in lower income taxes primarily related to lower
pre-tax income, and a $6.8 million reduction in earnings attributable
to non-controlling interests due to the lower pre-tax earnings.
Due to the deconsolidation of Enogex LLC on May 1, 2013 as
discussed above, the Company recorded no operating income for
this segment for the eight month period from May 1, 2013 through
December 31, 2013. Earnings in this eight month period reflect the
Company’s equity interest in Enable’s results, which are recorded in
equity in earnings of unconsolidated affiliate, and the related tax effect.
The table set forth below illustrates the impact of the operating results
of Enogex LLC and Enable for the four months ended April 30, 2013,
and the eight months from May 1, 2013 to December 31, 2013,
respectively.
Results for Enable for the eight months ended December 31, 2013,
were consistent with management’s expectations in light of lower
natural gas liquids prices and low seasonal and geographic price
differentials. Enable continued to increase processing volumes through
system expansions. Transportation throughput was impacted by system
integrity projects and slightly lower demand. Gathering throughput was
slightly lower, impacted by well connects, with lower throughput offset
by the impact of minimum commitment features. For the eight-month
period from May 1, 2013 to December 31, 2013 as compared to the
same period in 2012 there was a $44.5 million increase in net income
in large part reflecting the accretive impact of the Enable formation.
Included in that increase was a $24.9 million reduction in deferred state
income taxes, associated with a remeasurement of the accumulated
deferred taxes related to the formation of Enable partially offset by
deferred tax adjustments related to the Company’s deconsolidation
of Enogex Holdings and higher pre-tax income (net of noncontrolling
interest). Enable continued to increase processing volumes through
system expansions. Transportation throughput was impacted by system
integrity projects and slightly lower demand. Gathering throughput was
slightly lower, impacted by well connects, with lower throughput offset
by the impact of minimum commitment features.
For the year ended December 31, 2013, OGE Holdings’ net income
increased $25.8 million as a result of the $44.5 million increase in net
income for eight months ended December 31, offset in part by the
$18.7 million reduction for the four months ended April 30.
Off-Balance Sheet Arrangement
OG&E Railcar Lease Agreement
OG&E has a noncancellable operating lease with purchase options,
covering 1,387 coal rotary gondola railcars to transport coal from
Wyoming to OG&E’s coal-fired generation units. Rental payments are
charged to Fuel Expense and are recovered through OG&E’s tariffs
and fuel adjustment clauses. On December 15, 2010, OG&E renewed
the lease agreement effective February 1, 2011. At the end of the new
lease term, which is February 1, 2016, OG&E has the option to either
purchase the railcars at a stipulated fair market value or renew the
lease. If OG&E chooses not to purchase the railcars or renew the lease
agreement and the actual fair value of the railcars is less than the
stipulated fair market value, OG&E would be responsible for the
difference in those values up to a maximum of $22.8 million. OG&E is
also required to maintain all of the railcars it has under the operating
lease and has entered into an agreement with a non-affiliated company
to furnish this maintenance.
On January 11, 2012, OG&E executed a five-year lease agreement
for 135 railcars to replace railcars that have been taken out of service
or destroyed. OG&E has a unilateral right to terminate this lease upon
a 6-month notice effective April 2016.
On October 14, 2014, OG&E signed a three-year lease effective
beginning December 2014 for 131 railcars to replace railcars that have
been taken out of service or destroyed.
Liquidity and Capital Resources
Working Capital
Working capital is defined as the amount by which current assets
exceed current liabilities. The Company’s working capital requirements
are driven generally by changes in accounts receivable, accounts
payable, commodity prices, credit extended to, and the timing of
collections from, customers, the level and timing of spending for
maintenance and expansion activity, inventory levels and fuel
recoveries.
The balance of Income Taxes Receivable was $16.0 million and
$5.6 million at December 31, 2014 and 2013, respectively, an increase
of $10.4 million, primarily due to a receivable related to Oklahoma wind
credits and overpayments refundable from Louisiana.
The balance of Fuel Inventories was $58.5 million and $74.4 million
at December 31, 2014 and 2013, respectively, a decrease of
$15.9 million, or 21.4 percent, primarily due to lower coal inventory
balances at OG&E’s coal fired plants resulting from higher generation
related to OG&E’s participation in the Integrated Market along with
lower deliveries due to market constraints.
The balance of Deferred Income Tax assets was $191.4 million
and $215.8 million at December 31, 2014 and 2013, respectively, a
decrease of $24.4 million, or 11.3 percent, primarily due to a decrease
in deferred income taxes reflecting the expected utilization of net
operating losses.
The balance of Fuel Clause Under Recoveries was $68.3 million
and $26.2 million at December 31, 2014 and 2013, respectively, an
increase of $42.1 million, primarily due to lower amounts billed to
OG&E retail customers as compared to the actual cost of fuel and
purchased power. The fuel recovery clauses are designed to smooth
the impact of fuel price volatility on customers’ bills. As a result, OG&E
under recovers fuel costs when the actual fuel and purchased power
cost recoveries exceed fuel adjustment clause recoveries and over
recovers fuel costs when the actual fuel and purchased power costs
are below the fuel adjustment clause recoveries. Provisions in the fuel
clauses are intended to allow OG&E to amortize under and over
recovery balances into future cost recoveries.
The balance of Short-Term Debt was $98.0 million and
$439.6 million at December 31, 2014 and 2013, respectively, a
decrease of $341.6 million or 77.7 percent, primarily due to proceeds
received from a $250 million bond issuance in December 2014 along
with distributions from Enable.
The balance of Accounts Payable was $179.1 million and
$251.0 million at December 31, 2014 and 2013, respectively, a
decrease of $71.9 million, or 28.6 percent, primarily due to a decrease
of fuel and purchased power mainly due to participation in the SPP
Integrated Marketplace along with milder weather in 2014. Additionally,
there was a decrease in accounts payable related to the timing of
vendor payments.
The balance of Accrued Compensation was $38.2 million and
$56.9 million at December 31, 2014 and 2013, respectively, a decrease
of $18.7 million, or 32.9 percent, primarily resulting from the payment
of incentive compensation for Enable employees related to 2013 as
well as lower levels of accrued incentive compensation for 2014.
The balance of Long-Term Debt due within one year had no balance
as of December 31, 2014 compared to $100.0 million at December 31,
2013, primarily due to a senior note that was due to mature in
November 2014. The Company made the decision to refinance the
note in August 2014 and it was reclassified as long term debt at
that time.
Natural Gas Natural Gas
Midstream Operations OGE Holdings Total Midstream Operations
(Consolidated - Four Months (Equity Method -Eight Months (Year Ended (Consolidated - Year Ended
(In millions) Ended April 30, 2013) Ended December 31, 2013) December 31, 2013) December 31, 2012)
Operating revenues $630.4 $ — $630.4 $1,608.6
Cost of sales 489.0 — 489.0 1,120.1
Operating expenses 108.2 — 108.2 302.9
Operating income 33.2 — 33.2 185.6
Equity in earnings of unconsolidated affiliates — 101.9 101.9 —
Other income (expense) 8.9 — 8.9 (3.5)
Interest expense 10.6 — 10.6 32.6
Earnings before income taxes 31.5 101.9 133.4 149.5
Income tax expense 9.4 17.5 26.9 45.7
Net income 22.1 84.4 106.5 103.8
Less: net income attributable to
noncontrolling interests 6.6 — 6.6 29.7
Net income attributable to OGE Energy $ 15.5 $ 84.4 $ 99.9 $ 74.1