OG&E 2014 Annual Report Download - page 2
Download and view the complete annual report
Please find page 2 of the 2014 OG&E annual report below. You can navigate through the pages in the report by either clicking on the pages listed below, or by using the keyword search tool below to find specific information within the annual report.-
 1
1 -
 2
2 -
 3
3 -
 4
4 -
 5
5 -
 6
6 -
 7
7 -
 8
8 -
 9
9 -
 10
10 -
 11
11 -
 12
12 -
 13
13 -
14
-
15
-
16
-
17
-
18
-
19
-
20
-
21
-
22
-
23
-
24
-
25
-
26
-
27
-
28
-
29
-
30
-
31
-
32
-
33
-
34
-
35
-
36
-
37
 |
 |

OGE Energy Corp. (NYSE: OGE), with headquarters in
Oklahoma City, is the parent company of Oklahoma Gas and
Electric Company (OG&E), a regulated electric utility, and holds a
26.3 percent limited partner interest and 50 percent general partner
interest in Enable Midstream Partners, LP (Enable Midstream), a
natural gas pipeline business. OGE Energy, its subsidiary and
Enable Midstream have approximately 3,300 employees.
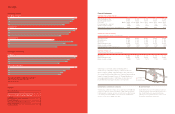
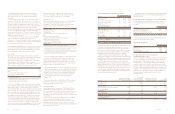
OGE Energy Corp. Common Stock Data
2014 2013 2012 2011 2010
Diluted earnings per share $ 1.98 $ 1.94 $ 1.79 $ 1.73 $ 1.50
Dividends paid per share(A) $ 0.93 $ 0.84 $ 0.79 $ 0.75 $ 0.73
Price range $32.85 – 39.28 $27.70 – 40.00 $25.12 – 30.11 $20.28 – 28.59 $16.94 – 23.09
Price/earnings ratio – year end 17.9 17.5 15.7 16.4 15.3
Return on equity – average 12.6% 13.4% 13.3% 14.9% 14.5%
Diluted average common shares outstanding (millions) 199.9 199.4 198.1 198.5 197.8
(A) Dividends were paid quarterly.
Oklahoma Gas and Electric Company
(In millions except EPS, before elimination of inter-segment items)
2014 2013 2012 2011 2010
Operating revenues $2,453 $2,262 $2,141 $2,212 $2,110
Operating income $ 538 $ 525 $ 489 $ 472 $ 414
Net income $ 292 $ 293 $ 280 $ 263 $ 216
Diluted earnings per share $ 1.46 $ 1.47 $ 1.42 $ 1.33 $ 1.09
Return on equity – average 10.0% 10.6% 10.9% 11.3% 10.3%
Total electricity sales (millions of megawatt hours) 30.2 28.6 29.4 29.5 28.1
OGE Enogex Holdings LLC
(In millions except EPS, before elimination of inter-segment items)
2014 2013 2012 2011 2010
Net income $ 102 $ 100 $ 74 $ 82 $ 91
Diluted earnings per share $ 0.51 $ 0.50 $ 0.38 $ 0.42 $ 0.46
Return on equity – average 13.8% 15.8% 13.7% 17.9% 20.5%
Financial Performance
Oklahoma Gas and Electric Company
Oklahoma Gas and Electric Company services approximately 815,000 retail
customers in Oklahoma and western Arkansas. OG&E, with approximately
6,900 megawatts of capacity, generates electricity from low-sulfur Wyoming
coal, natural gas and wind. OG&E’s electric transmission and distribution
systems cover an area of 30,000 square miles.
Enable Midstream
Enable Midstream operates the natural gas businesses
of OGE Energy Corp. and CenterPoint Energy Resources
Corp. Enable Midstream is engaged in natural gas
gathering, processing and fractionation services, crude
oil gathering, transportation and storage.
Contents
Financial Performance ______________________________________ 1
Letter to Shareholders _____________________________________ 02
COMMITTED TO POWER AT THE SPEED OF LIFE® ___________ 04
COMMITTED TO POSITIVE ENERGY TOGETHER® ____________ 06
Leadership ________________________________________________ 08
Management’s Discussion and Analysis ____________________ 09
Financial Statements ______________________________________ 31
Notes to Consolidated Financial Statements ________________ 38
Historical Performance ____________________________________ 68
Investor Information _______________________________________ 69
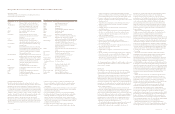
2014 Highlights for OG&E
This is OGE
Dividends Declared Per Share2
2014
2013
2012
2011
2010
0.95000
0.85125
0.79750
0.78575
0.73125
Net Income
2014
2013
2012
2011
2010
395.8
387.6
355.0
342.9
295.3
Gross Margin on Revenues1
2014
2013
2012
2011
2010
1, 3 4 6 . 5
1,29 6 . 3
1,26 2 .1
1,19 8 . 0
1,10 9 . 7
Operating Income
2014
2013
2012
2011
2010
538.0
525.3
489.4
472.3
413.7
Capital Expenditures
2014
2013
2012
2011
2010
565.4
797.6
704.4
844.5
603.4
1
Gross margin is defined by OG&E as operating revenues less fuel, purchased
power and transmission expenses. See “Management’s Discussion and
Analysis of Financial Condition and Results of Operations.
2Adjusted to reflect stock split.
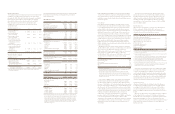
2014 Highlights for OGE Energy
OG&E Service Area
Power Plants
Wind Power Facilities