OG&E 2014 Annual Report Download - page 17
Download and view the complete annual report
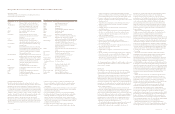
Please find page 17 of the 2014 OG&E annual report below. You can navigate through the pages in the report by either clicking on the pages listed below, or by using the keyword search tool below to find specific information within the annual report.-
 1
1 -
2
-
3
-
4
-
5
-
6
-
 7
7 -
 8
8 -
 9
9 -
 10
10 -
 11
11 -
 12
12 -
 13
13 -
 14
14 -
 15
15 -
 16
16 -
 17
17 -
 18
18 -
 19
19 -
 20
20 -
 21
21 -
 22
22 -
 23
23 -
 24
24 -
 25
25 -
 26
26 -
 27
27 -
28
-
29
-
30
-
31
-
32
-
33
-
34
-
35
-
36
-
37
 |
 |

30 OGE Energy Corp. OGE Energy Corp. 31
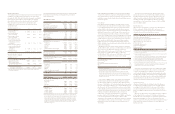
Consolidated Statements of Income
Year ended December 31 (In millions except per share data) 2014 2013 2012
Operating revenues
Electric Utility $ 2,453.1 $ 2,259.7 $ 2,128.7
Natural Gas Midstream Operations (Note 1) — 608.0 1,542.5
Total operating revenues 2,453.1 2,867.7 3,671.2
Cost of Sales
Electric Utility 1,106.6 950.0 831.4
Natural Gas Midstream Operations (Note 1) — 478.9 1,087.3
Total cost of sales 1,106.6 1,428.9 1,918.7
Operating Expenses
Other operation and maintenance 439.6 489.2 601.5
Depreciation and amortization 281.4 297.3 371.4
Gain on insurance proceeds — — (7.5)
Taxes other than income 88.7 98.8 110.2
Total operating expenses 809.7 885.3 1,075.6
Operating Income 536.8 553.5 676.9
Other Income (Expense)
Equity in earnings of unconsolidated affiliates (Note 1) 172.6 101.9 —
Allowance for equity funds used during construction 4.2 6.6 6.2
Other income 17.8 31.8 17.6
Other expense (14.4) (22.2) (16.5)
Net other income 180.2 118.1 7.3
Interest Expense
Interest on long-term debt 144.6 145.6 158.9
Allowance for borrowed funds used during construction (2.4) (3.4) (3.5)
Interest on short-term debt and other interest charges 6.2 5.3 8.7
Interest expense 148.4 147.5 164.1
Income Before Taxes 568.6 524.1 520.1
Income Tax Expense 172.8 130.3 135.1
Net Income 395.8 393.8 385.0
Less: net income attributable to noncontrolling interests — 6.2 30.0
Net Income Attributable to OGE Energy $ 395.8 $ 387.6 $ 355.0
Basic Average Common Shares Outstanding 199.2 198.2 197.1
Diluted Average Common Shares Outstanding 199.9 199.4 198.1
Basic Earnings Per Average Common Share Attributable to
OGE Energy Common Shareholders $ 1.99 $ 1.96 $ 1.80
Diluted Earnings Per Average Common Share Attributable to
OGE Energy Common Shareholders $ 1.98 $ 1.94 $ 1.79
Dividends Declared Per Common Share $0.95000 $0.85125 $0.79750
The accompanying Notes to Consolidated Financial Statements are an integral part hereof.
Market risks are, in most cases, risks that are actively traded in a
marketplace and have been well studied in regards to quantification.
Market risks include, but are not limited to, changes in interest rates
and commodity prices. The Company’s exposure to changes in interest
rates relates primarily to short-term variable-rate debt and commercial
paper. The Company is exposed to commodity prices in its operations.
Risk Oversight Committee
Management monitors market risks using a risk committee structure.
The Company’s Risk Oversight Committee, which consists primarily
of corporate officers, is responsible for the overall development,
implementation and enforcement of strategies and policies for all
market risk management activities of the Company. This committee’s
emphasis is a holistic perspective of risk measurement and policies
targeting the Company’s overall financial performance. On a quarterly
basis, the Risk Oversight Committee reports to the Audit Committee
of the Company’s Board of Directors on the Company’s risk profile
affecting anticipated financial results, including any significant
risk issues.
The Company also has a Corporate Risk Management Department.
This group, in conjunction with the aforementioned committees, is
responsible for establishing and enforcing the Company’s risk policies.
Quantitative and Qualitative Disclosures About Market Risk.
Risk Policies
Management utilizes risk policies to control the amount of market risk
exposure. These policies are designed to provide the Audit Committee
of the Company’s Board of Directors and senior executives of the
Company with confidence that the risks taken on by the Company’s
business activities are in accordance with their expectations for
financial returns and that the approved policies and controls related to
market risk management are being followed.
Interest Rate Risk
The Company’s exposure to changes in interest rates primarily relates
to short-term variable-rate debt and commercial paper. The Company
manages its interest rate exposure by monitoring and limiting the
effects of market changes in interest rates. The Company may utilize
interest rate derivatives to alter interest rate exposure in an attempt to
reduce the effects of these changes. Interest rate derivatives are used
solely to modify interest rate exposure and not to modify the overall
leverage of the debt portfolio.
The fair value of the Company’s long-term debt is based on quoted
market prices and estimates of current rates available for similar issues
with similar maturities or by calculating the net present value of the
monthly payments discounted by the Company’s current borrowing
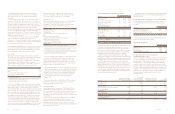
rate. The following table shows the Company’s long-term debt
maturities and the weighted-average interest rates by maturity date.
Year ended December 31 12/31/14
(Dollars in millions) 2015 2016 2017 2018 2019 Thereafter Total Fair Value
Fixed-rate debt (A)
Principal amount $ 0.2 $110.2 $125.1 $250.1 $250.1 $1,794.5 $2,530.2 $2,968.0
Weighted-average interest rate 3.02% 5.15% 6.50% 6.35% 8.25% 5.20% 5.67%
Variable-rate debt (B)
Principal amount $ — $ — $100.0 $ — $ — $ 135.4 $ 235.4 $ 235.3
Weighted-average interest rate —% —% 0.78% —% —% 0.07% 0.38%
(A) Prior to or when these debt obligations mature, the Company may refinance all or a portion of such debt at then-existing market interest rates which may be more or less than the
interest rates on the maturing debt.
(B) A hypothetical change of 100 basis points in the underlying variable interest rate incurred by the Company would change interest expense by $2.4 million annually through 2017 and
$1.4 million thereafter.