Navy Federal Credit Union 2014 Annual Report Download - page 37
Download and view the complete annual report
Please find page 37 of the 2014 Navy Federal Credit Union annual report below. You can navigate through the pages in the report by either clicking on the pages listed below, or by using the keyword search tool below to find specific information within the annual report.-
 1
1 -
2
-
3
-
4
-
5
-
6
-
7
-
8
-
9
-
10
-
11
-
12
-
13
-
14
-
15
-
16
-
17
-
18
-
19
-
20
-
21
-
22
-
23
-
24
-
25
-
26
-
 27
27 -
 28
28 -
 29
29 -
 30
30 -
 31
31 -
 32
32 -
 33
33 -
 34
34 -
 35
35 -
 36
36 -
 37
37 -
 38
38 -
 39
39 -
 40
40 -
 41
41 -
 42
42 -
 43
43 -
 44
44 -
 45
45 -
 46
46 -
 47
47 -
48
-
49
-
50
-
51
-
52
-
53
-
54
-
55
-
56
-
57
-
58
-
59
-
60
-
61
-
62
-
63
-
64
-
65
-
66
-
67
-
68
-
69
-
70
-
71
-
72
 |
 |

Financial Section 19
2014 | A YEAR IN REVIEW
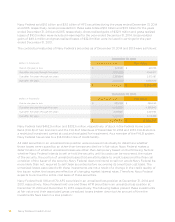
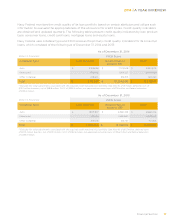
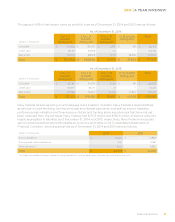
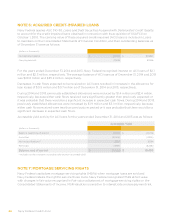
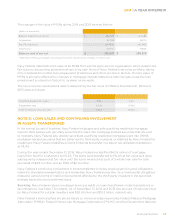
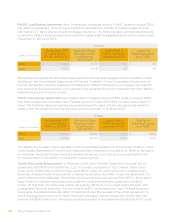
Navy Federal uses delinquency status and FICO score as the primary credit quality indicators for its
equity loans, which consisted of the following as of December 31, 2014 and 2013:
As of December 31, 2014
(dollars in thousands) FICO Score
Delinquency Status Less than 610 Greater than or
equal to 610
Total(1)
Performing $ 232,832 $ 2,144,443 $ 2,377,275
60+ days & foreclosure 30,039 12,326 42,365
Total $ 262,871 $ 2,156,769 $ 2,419,640
(1)Excludes fair value adjustments associated with the ACI portfolio (See Note 6) of $(12.7) million, deferred costs of $12.4 million, other
adjustments of $(0.6) million and loans in process of $0.7 million.
As of December 31, 2013
(dollars in thousands) FICO Score
Delinquency Status Less than 610 Greater than or
equal to 610
Total(1)
Performing $ 280,741 $ 2,114,887 $ 2,395,628
60+ days & foreclosure 40,606 15,156 55,762
Total $ 321,347 $ 2,130,043 $ 2,451,390
(1)Excludes fair value adjustments associated with the ACI portfolio (See Note 6) of $(14.5) million, deferred costs of $8.6 million and loans in
process of $1.4 million.
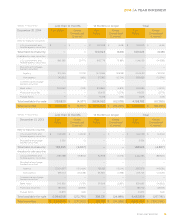
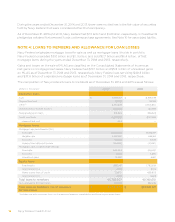
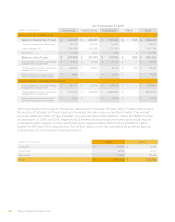
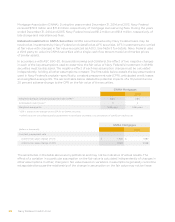
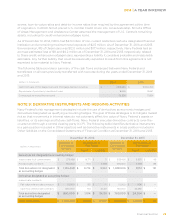
Changes in the allowance for loan losses during the years ended December 31, 2014 and 2013 were
as follows:
As of December 31, 2014
(dollars in thousands) Consumer Credit Cards Real Estate Other Total
Allowance for credit losses:
Balance, beginning of year $ 237,358 $ 251,447 $ 150,185 $ 249 $ 639,239
Provision charged to operations 315,269 336,197 12,580 (249) 663,797
Loans charged o (298,997) (270,096) (48,816) — (617,909)
Recoveries 44,002 17,795 5,911 — 67,708
Balance, end of year $ 297,632 $ 335,343 $ 119,860 $ — $ 752,835
Ending balance: loans individually
evaluated for impairment $ 56,454 $ 68,674 $ 82,582 $ — $ 207,710
Ending balance: loans collectively
evaluated for impairment $ 231,572 $ 266,669 $ 26,479 $ — $ 524,720
Ending balance: loans acquired
with deteriorated credit quality $ 9,606 $ — $ 10,799 $ — $ 20,405
Loan amount (excluding allowance):
Ending balance: loans individually
evaluated for impairment $ 404,495 $ 259,620 $ 570,262 $ — $ 1,234,377
Ending balance: loans collectively
evaluated for impairment $ 13,705,515 $ 9,248,205 $ 21,980,661 $ — $ 44,934,381
Ending balance: loans acquired
with deteriorated credit quality $ 4,398 $ — $ 41,231 $ — $ 45,629