Navy Federal Credit Union 2014 Annual Report Download - page 23
Download and view the complete annual report
Please find page 23 of the 2014 Navy Federal Credit Union annual report below. You can navigate through the pages in the report by either clicking on the pages listed below, or by using the keyword search tool below to find specific information within the annual report.-
 1
1 -
2
-
3
-
4
-
5
-
6
-
7
-
8
-
9
-
10
-
11
-
12
-
 13
13 -
 14
14 -
 15
15 -
 16
16 -
 17
17 -
 18
18 -
 19
19 -
 20
20 -
 21
21 -
 22
22 -
 23
23 -
 24
24 -
 25
25 -
 26
26 -
 27
27 -
 28
28 -
 29
29 -
 30
30 -
 31
31 -
 32
32 -
 33
33 -
34
-
35
-
36
-
37
-
38
-
39
-
40
-
41
-
42
-
43
-
44
-
45
-
46
-
47
-
48
-
49
-
50
-
51
-
52
-
53
-
54
-
55
-
56
-
57
-
58
-
59
-
60
-
61
-
62
-
63
-
64
-
65
-
66
-
67
-
68
-
69
-
70
-
71
-
72
 |
 |
Financial Section 5
2014 | A YEAR IN REVIEW
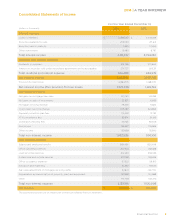
Consolidated Statements of Cash Flows
(dollars in thousands) For the Year Ended December 31,
Cash flows from operating activities 2014 2013
Net income $ 718,830 $ 695,838
Adjustments to reconcile net income to net cash provided
by operating activities:
Provision for loan losses 668,279 468,019
Depreciation and amortization of property, plant and equipment 123,818 104,888
Losses on disposal of property, plant and equipment 234 765
Gains on sale of investments (22,657) (16,855)
Amortization of loan origination fees and costs 6,452 5,016
Losses/(gains) valuation on mortgage servicing rights 34,841 (22,774)
Mortgage loans originated for sale (2,740,896) (5,560,055)
Gains on sale of mortgages (86,386) (38,728)
Mortgage loan sales proceeds 2,774,377 5,940,454
Accretion and amortization of AFS investment securities 47,509 74,308
Accretion and amortization of HTM investment securities 15 335
Increase in mortgage servicing rights (34,063) (63,788)
Increase in accrued interest receivable (16,141) (1,940)
Increase in prepaid expenses (10,508) (6,710)
Increase in accounts receivable (500,314) (64,927)
Decrease in other intangible assets 383 509
Increase in other assets (25,203) (2,019)
(Decrease)/increase in drafts payable (2,227) 27,059
Increase in accrued expenses and accounts payable 106,738 85,278
Increase in accrued interest payable 1,033 702
Increase in other liabilities 7,683 34,706
Net cash provided by operating activities 1,051,797 1,660,081
Cash flows from investing activities
Net decrease in short-term and interest-bearing deposits 60,964 1,470,200
Purchase of AFS investment securities (3,385,490) (4,615,162)
Purchase of HTM investment securities (149,711) —
Proceeds from maturities, paydowns, calls and sales of AFS investment securities 2,529,195 5,298,641
Proceeds from maturities, paydowns, and calls of HTM investment securities 157,646 92,383
Net (purchases)/redemptions of FHLB stock (130,246) 71,166
Proceeds from loans sold originated for investment 43,906 —
Net increase in loans to members (7,215,632) (6,270,359)
Purchases and sales of property, plant and equipment (248,465) (156,697)
Increase in deposit to NCUSIF (34,126) (33,385)
Proceeds from REO sales 30,491 35,982
Net cash used in investing activities (8,341,468) (4,107,231)
Cash flows from financing activities
Net increase in members’ accounts from savings, checking and IRA accounts 3,229,882 2,605,533
Net increase in members’ accounts from issuance and maturity of CDs 886,491 36,732
Net increase in members’ accounts from borrowers’ escrow 13,785 16,346
Net increase in securities sold under repurchase agreements 65,203 1,354,299
Proceeds from borrowings 6,300,000 2,165,002
Repayments of notes payable (3,281,635) (3,595,352)
Net cash provided by financing activities 7,213,726 2,582,560
Net (decrease)/increase in cash (75,945) 135,410
Cash at beginning of year 501,906 366,496
Cash at end of year $ 425,961 $ 501,906
Supplemental cash flow information:
Interest paid $ 625,450 $ 636,274
Transfers from loans to other real estate 28,866 33,146
The accompanying notes are an integral part of these consolidated financial statements.