Navy Federal Credit Union 2014 Annual Report Download - page 36
Download and view the complete annual report
Please find page 36 of the 2014 Navy Federal Credit Union annual report below. You can navigate through the pages in the report by either clicking on the pages listed below, or by using the keyword search tool below to find specific information within the annual report.-
 1
1 -
2
-
3
-
4
-
5
-
6
-
7
-
8
-
9
-
10
-
11
-
12
-
13
-
14
-
15
-
16
-
17
-
18
-
19
-
20
-
21
-
22
-
23
-
24
-
25
-
 26
26 -
 27
27 -
 28
28 -
 29
29 -
 30
30 -
 31
31 -
 32
32 -
 33
33 -
 34
34 -
 35
35 -
 36
36 -
 37
37 -
 38
38 -
 39
39 -
 40
40 -
 41
41 -
 42
42 -
 43
43 -
 44
44 -
 45
45 -
 46
46 -
47
-
48
-
49
-
50
-
51
-
52
-
53
-
54
-
55
-
56
-
57
-
58
-
59
-
60
-
61
-
62
-
63
-
64
-
65
-
66
-
67
-
68
-
69
-
70
-
71
-
72
 |
 |

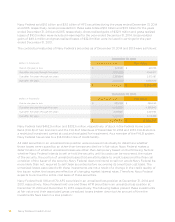
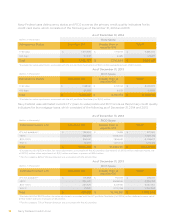
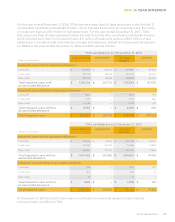
Navy Federal Credit Union18
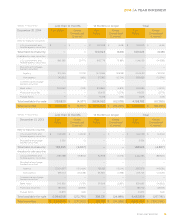
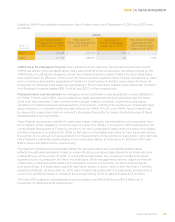
Navy Federal uses delinquency status and FICO score as the primary credit quality indicators for its
credit card loans, which consisted of the following as of December 31, 2014 and 2013:
As of December 31, 2014
(dollars in thousands) FICO Score
Delinquency Status Less than 610 Greater than or
equal to 610
Total(1)
<=60 days $ 1,675,335 $ 7,710,159 $ 9,385,494
>60 days 117,442 6,485 123,927
Total $ 1,792,777 $ 7,716,644 $ 9,509,421
(1)Excludes fair value adjustments associated with the ACI portfolio (See Note 6) of $(2.1) million and deferred cost of $0.5 million.
As of December 31, 2013
(dollars in thousands) FICO Score
Delinquency Status Less than 610 Greater than or
equal to 610
Total(1)
<=60 days $ 1,338,561 $ 6,701,134 $ 8,039,695
>60 days 84,356 6,039 90,395
Total $ 1,422,917 $ 6,707,173 $ 8,130,090
(1)Excludes fair value adjustments associated with the ACI portfolio (See Note 6) of $(2.6) million.
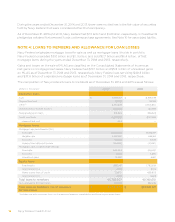
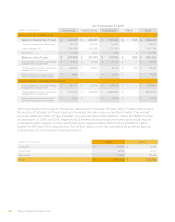
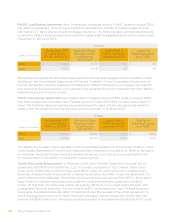
Navy Federal uses estimated current LTV (loan-to-value) ratios and FICO score as the primary credit quality
indicators for its mortgage loans, which consisted of the following as of December 31, 2014 and 2013:
As of December 31, 2014
(dollars in thousands) FICO Score
Estimated Current LTV Less than 610 Greater than or
equal to 610
Total(1)
LTV not available(2) $ 152,644 $ 74,818 $ 227,462
<80% 453,309 10,118,404 10,571,713
80%–100% 354,041 7,854,631 8,208,672
100+% 70,870 1,201,442 1,272,312
Total $ 1,030,864 $ 19,249,295 $ 20,280,159
(1)Excludes MLAS of $572.4 million, fair value adjustments associated with the ACI portfolio (See Note 6) of $(17.0) million, deferred income, net
of $(117.0) million, other adjustments of $(3.1) million and loans in process of $29.6 million.
(2)For this category, 83% of the loan balances are associated with the ACI portfolio.
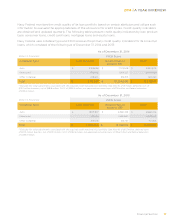
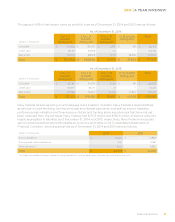
As of December 31, 2013
(dollars in thousands) FICO Score
Estimated Current LTV Less than 610 Greater than or
equal to 610
Total(1)
LTV not available(2) $ 145,368 $ 90,006 $ 235,374
<80% 354,637 8,484,126 8,838,763
80%–100% 285,529 5,401,931 5,687,460
100+% 171,547 2,170,798 2,342,345
Total $ 957,081 $ 16,146,861 $ 17,103,942
(1)Excludes MLAS of $507.9 million, fair value adjustments associated with the ACI portfolio (See Note 6) of $(19.4) million, deferred income, net of
$(111.3) million and loans in process of $5.4 million.
(2)For this category, 77% of the loan balances are associated with the ACI portfolio.