Motorola 1999 Annual Report Download - page 33
Download and view the complete annual report
Please find page 33 of the 1999 Motorola annual report below. You can navigate through the pages in the report by either clicking on the pages listed below, or by using the keyword search tool below to find specific information within the annual report.-
 1
1 -
2
-
3
-
4
-
5
-
6
-
7
-
8
-
9
-
10
-
11
-
12
-
13
-
14
-
15
-
16
-
17
-
18
-
19
-
20
-
21
-
22
-
 23
23 -
 24
24 -
 25
25 -
 26
26 -
 27
27 -
 28
28 -
 29
29 -
 30
30 -
 31
31 -
 32
32 -
 33
33 -
 34
34 -
 35
35 -
 36
36
 |
 |

MOTOROLA, INC. AND SUBSIDIARIES 31
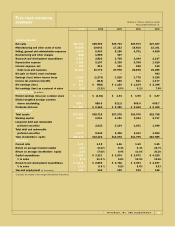
1999 1998 1997 1996 1995
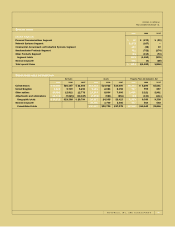
Operating Results
Net sales $30,931« $29,398« $29,794 $27,973 $27,037
Manufacturing and other costs of sales ÷19,169« 18,043« 17,283 16,610 15,361
Selling, general and administrative expenses ÷5,045« 5,443« 5,160 4,701 4,629
Restructuring and other charges ÷(226)« 1,980« 327 – –
Research and development expenditures ÷3,438« 2,893« 2,748 2,394 2,197
Depreciation expense ÷2,182« 2,197« 2,329 2,308 1,919
Interest expense, net ÷155« 216« 131 185 149
Total costs and expenses ÷29,763« 30,772« 27,978 26,198 24,255
Net gain on Nextel asset exchange ÷–« –« – – 443
Earnings (loss) before income taxes ÷1,168« (1,374)« 1,816 1,775 3,225
Income tax provision (benefit) ÷351« (412)« 636 621 1,177
Net earnings (loss) $««÷«817« $««÷(962)« $««1,180 $««1,154 $÷2,048
Net earnings (loss) as a percent of sales ÷2.6%« (3.3)«% 4.0% 4.1% 7.6%
Per Share Data (in dollars)
Diluted earnings (loss) per common share $««««1.31« $«««(1.61)« $««««1.94 $««««1.90 $÷÷3.37
Diluted weighted average common
shares outstanding ÷624.7« 598.6« 612.2 609.0 609.7
Dividends declared $««0.480« $««0.480« $««0.480 $««0.460 $««0.400
Balance Sheet
Total assets $37,327« $28,728« $27,278 $24,076 $22,738
Working capital ÷4,087« 2,091« 4,181 3,324 2,717
Long-term debt and redeemable
preferred securities ÷3,573« 2,633« 2,144 1,931 1,949
Total debt and redeemable
preferred securities ÷6,077« 5,542« 3,426 3,313 3,554
Total stockholders’ equity $16,344« $12,222« $13,272 $11,795 $10,985
Other Data
Current ratio ÷1.33« 1.18« 1.46 1.42 1.35
Return on average invested capital 5.5%« (6.2)«% 8.4% 8.4% 16.7%
Return on average stockholders’ equity ÷5.9%« (7.6)«% 9.4% 10.0% 20.2%
Capital expenditures $««2,684« $««3,221« $««2,874 $««2,973 $÷4,225
% to sales ÷8.7% 11.0«% 9.6% 10.6% 15.6%
Research and development expenditures $««3,438« $««2,893« $««2,748 $««2,394 $÷2,197
% to sales ÷11.1% ÷9.8«% 9.2% 8.6% 8.1%
Year-end employment (in thousands) ÷121« 133« 150 139 142
1Excludes the impact of the merger with General Instrument.
MOTOROLA, INC. AND SUBSIDIARIES 32
FIVE-YEAR FINANCIAL
SUMMARY(Dollars in millions, except as noted)
Years Ended December 31
1