Motorola 1999 Annual Report Download - page 30
Download and view the complete annual report
Please find page 30 of the 1999 Motorola annual report below. You can navigate through the pages in the report by either clicking on the pages listed below, or by using the keyword search tool below to find specific information within the annual report.-
 1
1 -
2
-
3
-
4
-
5
-
6
-
7
-
8
-
9
-
10
-
11
-
12
-
13
-
14
-
15
-
16
-
17
-
18
-
19
-
 20
20 -
 21
21 -
 22
22 -
 23
23 -
 24
24 -
 25
25 -
 26
26 -
 27
27 -
 28
28 -
 29
29 -
 30
30 -
 31
31 -
 32
32 -
 33
33 -
 34
34 -
 35
35 -
 36
36
 |
 |

29 MOTOROLA, INC. AND SUBSIDIARIES
CONDENSED NOTES TO CONSOLIDATED
FINANCIAL STATEMENTS (Dollars in millions)
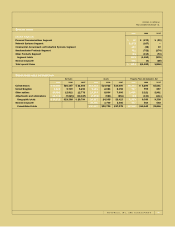
Years Ended December 31
Interest Income Interest Expense Net Interest
1999 1998 1997 1999 1998 1997 1999 1998 1997
Personal Communications
Segment $÷«««««17 $«««««««21 $«««««««21 $«««««61 $«««««73 $«««««48 $÷««(44) $««÷(52) $««««(27)
Network Systems Segment ÷1 – – ÷30 33 12 ÷(29) (33) (12)
Commercial, Government and
Industrial Systems Segment ÷– 2 4 ÷15 17 14 ÷(15) (15) (10)
Semiconductor Products
Segment 612 12 ÷81 116 71 ÷(75) (104) (59)
Other Products Segment 26 2 ÷33 30 14 ÷(31) (24) (12)
Segment totals ÷26 41 39 ÷220 269 159 ÷(194) ÷(228) (120)
General corporate 124 44 46 ÷85 32 57 ÷39 12 (11)
Consolidated totals $«««««150 $«««««««85 $«««««««85 $«««305 $«««301 $«««216 $««(155) $««(216) $««(131)
Assets Capital Expenditures Depreciation Expense
1999 1998 1997 1999 1998 1997 1999 1998 1997
Personal Communications
Segment $÷6,411 $÷5,476 $««6,105 $«««450 $«««442 $«««749 $«««398 $«««422 $«««539
Network Systems Segment ÷7,414 6,177 4,655 ÷262 345 415 ÷260 222 249
Commercial, Government and
Industrial Systems Segment ÷2,509 2,110 2,102 ÷152 224 180 ÷170 146 161
Semiconductor Products
Segment ÷7,872 8,232 7,947 ÷1,505 1,783 1,153 ÷1,131 1,178 1,169
Other Products Segment ÷4,117 3,393 3,062 ÷183 162 111 ÷146 184 163
Adjustments and eliminations (1,396) (420) (458) ––––– –
Segment totals ÷26,927 24,968 23,413 ÷2,552 2,956 2,608 ÷2,105 2,152 2,281
General corporate ÷10,400 3,760 3,865 ÷132 265 266 ÷77 45 48
Consolidated totals $37,327 $28,728 $27,278 $2,684 $3,221 $2,874 $2,182 $2,197 $2,329
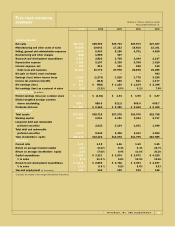
SEGMENT INFORMATION
Net Sales Operating Profit (Loss) Before Taxes
1999 1998 1997 1999 1998 1997
Personal Communications
Segment $11,932 $10,132 $11,026 $÷«608 5.1 % $÷«(373) (3.7) % $1,122 10.2 %
Network Systems Segment ÷6,544 7,064 6,061 ÷(479) (7.3) % 819 11.6 % 618 10.2 %
Commercial, Government and
Industrial Systems Segment ÷4,068 4,079 4,037 ÷609 15.0 % 412 10.1 % 345 8.5 %%
Semiconductor Products
Segment ÷7,370 7,314 8,003 ÷619 8.4 % (1,225) (16.7) % 168 2.1 %
Other Products Segment ÷3,736 3,623 3,855 (261) (7.0) % (896) (24.7) % (318) (8.2) %
Adjustments and eliminations (2,719) (2,814) (3,188) (4) 0.1 % 15 (0.5) % (48) 1.5 %
Segment totals $30,931 $29,398 $29,794 ÷1,092 3.5 % ÷(1,248) (4.2) % 1,887 6.3 %%
General corporate 76 (126) (71)
Earnings (loss) before
income taxes $1,168 3.8 % $(1,374) (4.7) % $1,816 6.1 %