Motorola 1999 Annual Report Download - page 31
Download and view the complete annual report
Please find page 31 of the 1999 Motorola annual report below. You can navigate through the pages in the report by either clicking on the pages listed below, or by using the keyword search tool below to find specific information within the annual report.
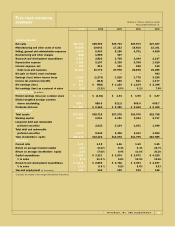
GEOGRAPHIC AREA INFORMATION
Net Sales Assets Property, Plant and Equipment, Net
1999 1998 1997 1999 1998 1997 1999 1998 1997
United States $«19,956 $20,397 $«21,809 $14,135 $14,932 $14,000 $5,142 $««5,294 $5,661
United Kingdom ÷6,221 5,709 5,254 ÷2,186 2,083 2,098 947 999 887
Other nations 20,686 12,812 12,778 ÷13,244 8,804 7,966 2,638 3,221 2,901
Adjustments and eliminations (15,932) (9,520)) (10,047) ÷(2,638) (851) (651) (88) (134) (111)
Geographic totals $«30,931 $29,398 $«29,794 ÷26,927 24,968 23,413 8,639 9,380 9,338
General corporate ÷10,400 3,760 3,865 607 669 518
Consolidated totals $37,327 $28,728 $27,278 $9,246 $10,049 $9,856
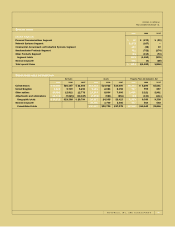
SPECIAL ITEMS
1999 1998 1997
Income (Expense)
Personal Communications Segment $««««««18 $«««(479) $««(20)
Network Systems Segment (1,272) (167) «–
Commercial, Government and Industrial Systems Segment 186 (46) 10
Semiconductor Products Segment 331 (752) (174)
Other Products Segment (95) (419) (94)
Segment totals (832) (1,863) (278)
General corporate 148 (6) (28)
Total special items ÷ $«««(684) $(1,869) $(306)
MOTOROLA, INC. AND SUBSIDIARIES 30
(Dollars in millions)
Years Ended December 31


