Mitsubishi 2013 Annual Report Download - page 7
Download and view the complete annual report
Please find page 7 of the 2013 Mitsubishi annual report below. You can navigate through the pages in the report by either clicking on the pages listed below, or by using the keyword search tool below to find specific information within the annual report.-
 1
1 -
 2
2 -
 3
3 -
 4
4 -
 5
5 -
 6
6 -
 7
7 -
 8
8 -
 9
9 -
 10
10 -
 11
11 -
 12
12 -
 13
13 -
 14
14 -
 15
15 -
 16
16 -
 17
17 -
 18
18 -
19
-
20
-
21
-
22
-
23
-
24
-
25
-
26
-
27
-
28
-
29
-
30
-
31
-
32
-
33
-
34
-
35
-
36
-
37
-
38
-
39
-
40
-
41
-
42
-
43
-
44
-
45
-
46
-
47
-
48
-
49
-
50
-
51
-
52
-
53
-
54
-
55
-
56
-
57
-
58
-
59
-
60
-
61
-
62
-
63
-
64
-
65
-
66
 |
 |

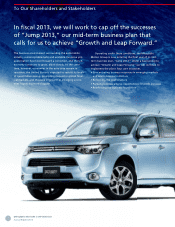
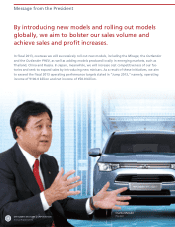
In scal 2012, the second year for our mid-term business plan,
“Jump 2013,” we worked to achieve “Growth and Leap For-
ward” through environmental initiatives and emerging-market
response projects. We worked to launch, produce and sell new
models in each eld. Speci cally, by product, we introduced
new models such as the Mirage, Outlander and Outlander
PHEV. On the production front, we boosted capacity in Thai-
land, China, Russia and other emerging markets. At the same
time, to bolster our strengths we sold our interest in Nether-
lands Car B.V. (NedCar), a loss-making European production
subsidiary, and we terminated production activities.
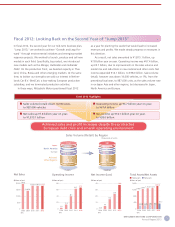
In these ways, Mitsubishi Motors positioned scal 2012
as a year for planting the seeds that would lead to increased
revenues and pro ts. We made steady progress on measures in
this direction.
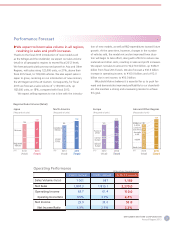
As a result, net sales amounted to ¥1,815.1 billion, up
¥7.8 billion year on year. Operating income was ¥67.4 billion,
up ¥3.7 billion, due to improvements in the sales volume and
model mix and reductions in raw material and other costs. Net
income expanded ¥14.1 billion, to ¥38.0 billion. Sales volume
(retail), however was down 14,000 vehicles, or 1%, from the
preceding scal year, to 987,000 units, as the sales volume rose
in ex-Japan Asia and other regions, but decreased in Japan,
North America and Europe.
Fiscal 2012 Highlights
Achieved sales and prot increases despite the protracted
European debt crisis and a harsh operating environment
Sales volume (retail) down 14,000 units,
to 987,000 vehicles
Net sales up ¥7.8 billion year on year,
to ¥1,815.1 billion
Operating income up ¥3.7 billion year on year,
to ¥67.4 billion
Net income up ¥14.1 billion year on year,
to ¥38.0 billion
FY2012FY2011
Japa
n
North America
Europe
Asia and
Other Regions
(Thousands of units)
Sales Volume (Retail) by Region
218
1,001
152
106
525
181
587
987
134
85
Net Sales
0
500
1,000
1,500
2,000
20122011201020092008
(Billions of yen)
1,828.5 1,807.3 1,815.1
(FY)
1,445.6
1,973.6
Operating Income
0
20
40
60
80
20122011201020092008
(FY)
(Billions of yen)
3.9
40.3
63.7 67.4
13.9
Total Assets/Net Assets
0
400
800
1,200
1,600
20122011201020092008
(FY)
(Billions of yen)
1,138.0
223.0 234.5 248.1 265.6
223.0 234.5 248.1 265.6
351.2
1,258.7 1,312.5 1,321.3
1,452.8
Net assetsTotal assets
Net Income (Loss)
0
10
20
30
40
20122011201020092008
(FY)
(Billions of yen)
-54.9
4.8
15.6
23.9
38.0
Fiscal 2012: Looking Back on the Second Year of “Jump 2013”
MITSUBISHI MOTORS CORPORATION
Annual Report 2013 5