Mitsubishi 2013 Annual Report Download - page 18
Download and view the complete annual report
Please find page 18 of the 2013 Mitsubishi annual report below. You can navigate through the pages in the report by either clicking on the pages listed below, or by using the keyword search tool below to find specific information within the annual report.-
 1
1 -
2
-
3
-
4
-
5
-
6
-
7
-
 8
8 -
 9
9 -
 10
10 -
 11
11 -
 12
12 -
 13
13 -
 14
14 -
 15
15 -
 16
16 -
 17
17 -
 18
18 -
 19
19 -
 20
20 -
 21
21 -
 22
22 -
 23
23 -
 24
24 -
 25
25 -
 26
26 -
 27
27 -
 28
28 -
29
-
30
-
31
-
32
-
33
-
34
-
35
-
36
-
37
-
38
-
39
-
40
-
41
-
42
-
43
-
44
-
45
-
46
-
47
-
48
-
49
-
50
-
51
-
52
-
53
-
54
-
55
-
56
-
57
-
58
-
59
-
60
-
61
-
62
-
63
-
64
-
65
-
66
 |
 |

In scal 2012, our sales volume (retail) was up substan-
tially year on year in Asia and other regions. However,
in Japan, North America and Europe, sales volume
fell below the previous year’s levels. As a result,
overall sales volume was down 14,000 units, or 1%,
to 987,000 units. In wholesale volume, on the other
hand, higher sales in Asia and other regions compen-
sated for declines in other geographic areas, bring-
ing up wholesale volume 48,000 units, or 4%, year
on year, to 1,120,000 units. Bolstered by the rise in
wholesale volume, net sales rose ¥7.8 billion, or 0.4%,
to ¥1,815.1 billion. Despite increases in costs on quali-
ty measures in market and selling expenses, operating
income expanded ¥3.7 billion, to ¥67.4 billion, due to
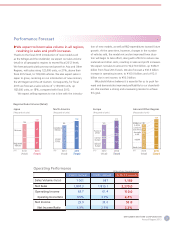
In scal 2013, we aim to increase sales volume in all
geographic regions.
Net Sales
(Billions of yen)
FY2011 FY2012 FY2013 (Forecast)
Japan 357.1 329.5 470.0
North America 195.2 157.7 210.0
Europe 474.8 400.7 510.0
Asia and Other Regions 780.2 927.2 1,080.0
Total 1,807.3 1,815.1 2,270.0
Operating Income (Loss)
(Billions of yen)
FY2011 FY2012 FY2013 (Forecast)
Japan 6.8 (27.6) (15.0)
North America (26.2) (20.0) (4.0)
Europe (15.6) (7.0) 20.0
Asia and Other Regions 98.7 122.0 99.0
Total 63.7 67.4 100.0
Sales Volume (Retail)
(Thousands of units)
FY2011 FY2012 FY2013 (Target)
Japan 152 134 148
North America 106 85 100
Europe 218 181 212
Asia and Other Regions 525 587 709
Total 1,001 987 1,169
0
500
1,000
1,500
2,000
2,500
2013
(Forecast)
20122011
157.7
(Billions of yen)
Japan North America Europe Asia and Other Regions
1,080.0
510.0
210.0
470.0
927.2
400.7
329.5
1,815.1
2,270.0
780.2
474.8
195.2
357.1
1,807.3
(Billions of yen)
Japan North America Europe Asia and Other Regions
-75
0
75
150
2013
(Forecast)
20122011
7,8 5 4 8,800
99.0
20.0
122.0
-4.0
-7.0
-15. 6
67.4 100.0
98.7
6.8
63.7
-26.2
-20.0
-27.6 -15.0
(Thousands of units)
Japan North America Europe Asia and Other Regions
0
300
600
900
1,200
2013
(Target)
20122011
709
212
100
148
587
181
85
134
987
1,169
525
218
106
152
1,001
Overview of Operations by Region
factors such as improvements in the sales volume and
product mix and ongoing efforts to reduce costs.
In scal 2013, we expect sales volume (retail) to
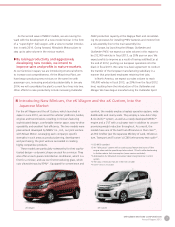
exceed scal 2012 levels in all geographic regions.
In Japan, we anticipate the rise in sales volume will
center on our new minicars, the eK Wagon and the
eK Custom. Overseas, we expect to boost sales of
global models, including the Mirage, Outlander,
Triton, Pajero Sport and Outlander PHEV, as well as
the Attrage, our new-model sedan produced in
Thailand. As a result, for scal 2013 we forecast a
sales volume of 1,169,000 units, up 182,000 units, or
18%, from the scal 2012 level. We also anticipate
net sales of ¥2,270.0 billion.
MITSUBISHI MOTORS CORPORATION
Annual Report 2013
16