Memorex 2011 Annual Report Download - page 72
Download and view the complete annual report
Please find page 72 of the 2011 Memorex annual report below. You can navigate through the pages in the report by either clicking on the pages listed below, or by using the keyword search tool below to find specific information within the annual report.-
 1
1 -
2
-
3
-
4
-
5
-
6
-
7
-
8
-
9
-
10
-
11
-
12
-
13
-
14
-
15
-
16
-
17
-
18
-
19
-
20
-
21
-
22
-
23
-
24
-
25
-
26
-
27
-
28
-
29
-
30
-
31
-
32
-
33
-
34
-
35
-
36
-
37
-
38
-
39
-
40
-
41
-
42
-
43
-
44
-
45
-
46
-
47
-
48
-
49
-
50
-
51
-
52
-
53
-
54
-
55
-
56
-
57
-
58
-
59
-
60
-
61
-
 62
62 -
 63
63 -
 64
64 -
 65
65 -
 66
66 -
 67
67 -
 68
68 -
 69
69 -
 70
70 -
 71
71 -
 72
72 -
 73
73 -
 74
74 -
 75
75 -
 76
76 -
 77
77 -
 78
78 -
 79
79 -
 80
80 -
 81
81 -
 82
82 -
83
-
84
-
85
-
86
-
87
-
88
-
89
-
90
-
91
-
92
-
93
-
94
-
95
-
96
-
97
-
98
-
99
-
100
-
101
-
102
-
103
-
104
-
105
-
106
-
107
-
108
-
109
-
110
-
111
-
112
-
113
-
114
 |
 |

NOTES TO CONSOLIDATED FINANCIAL STATEMENTS — (Continued)
Restricted Stock
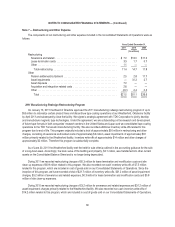
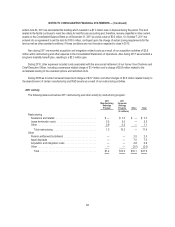
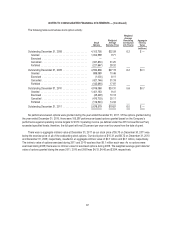
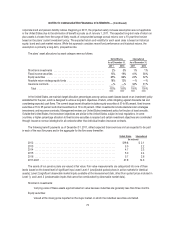
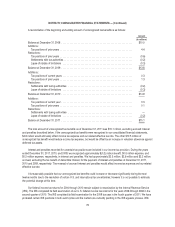
The following table summarizes our restricted stock activity:
Restricted
Stock
Weighted
Average
Grant Date
Fair Value
Per Share
Nonvested as of December 31, 2008 ...................................... 304,511 $28.98
Granted .......................................................... 327,654 9.38
Vested ........................................................... (119,074) 29.44
Forfeited ......................................................... (51,389) 30.04
Nonvested as of December 31, 2009 ...................................... 461,702 $14.84
Granted .......................................................... 524,655 10.45
Vested ........................................................... (209,302) 15.17
Forfeited ......................................................... (37,859) 11.15
Nonvested as of December 31, 2010 ...................................... 739,196 $11.34
Granted .......................................................... 385,049 9.28
Vested ........................................................... (274,934) 12.15
Forfeited ......................................................... (54,265) 12.05
Nonvested as of December 31, 2011 ...................................... 795,046 $10.02
There were no performance-based restricted shares granted during the year ended December 31, 2011. Of the
restricted shares granted during the year ended December 31, 2010, there were 265,837 performance-based restricted
shares granted based on the Company’s performance against operating income targets for 2010. Operating income (as
defined under the 2010 Annual Bonus Plan) exceeded specified levels; therefore, the full grant will vest 25 percent per year
over four years from the date of grant.
The total fair value of shares vested during the years 2011, 2010 and 2009 was $3.3 million, $3.2 million and
$3.5 million, respectively.
Total related stock-based compensation expense recognized in the Consolidated Statements of Operations for the years
ended December 31, 2011, 2010 and 2009 was $3.4 million, $3.1 million and $2.6 million, respectively. This expense would
result in related tax benefits of $1.3 million, $1.2 and $1.0 million for the years ended December 31, 2011, 2010 and 2009,
respectively. However, these tax benefits are included in the U.S. deferred tax assets which are subject to a full valuation
allowance and due to the valuation allowance, we did not recognize the related tax benefit in 2011 and 2010.
No related stock-based compensation was capitalized as part of an asset for the years ended December 31, 2011, 2010 or
2009. As of December 31, 2011, there was $5.7 million of total unrecognized compensation expense related to restricted stock
granted under our Stock Plans. That expense is expected to be recognized over a weighted average period of 2.2 years.
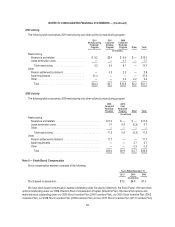
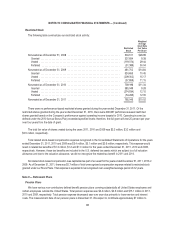
Note 9 — Retirement Plans
Pension Plans
We have various non-contributory defined benefit pension plans covering substantially all United States employees and
certain employees outside the United States. Total pension expense was $2.4 million, $4.5 million and $15.1 million in 2011,
2010 and 2009, respectively. Total pension expense decreased year over year due primarily to lower service and interest
costs. The measurement date of our pension plans is December 31. We expect to contribute approximately $7 million to
69