Memorex 2011 Annual Report Download - page 32
Download and view the complete annual report
Please find page 32 of the 2011 Memorex annual report below. You can navigate through the pages in the report by either clicking on the pages listed below, or by using the keyword search tool below to find specific information within the annual report.-
 1
1 -
2
-
3
-
4
-
5
-
6
-
7
-
8
-
9
-
10
-
11
-
12
-
13
-
14
-
15
-
16
-
17
-
18
-
19
-
20
-
21
-
 22
22 -
 23
23 -
 24
24 -
 25
25 -
 26
26 -
 27
27 -
 28
28 -
 29
29 -
 30
30 -
 31
31 -
 32
32 -
 33
33 -
 34
34 -
 35
35 -
 36
36 -
 37
37 -
 38
38 -
 39
39 -
 40
40 -
 41
41 -
 42
42 -
43
-
44
-
45
-
46
-
47
-
48
-
49
-
50
-
51
-
52
-
53
-
54
-
55
-
56
-
57
-
58
-
59
-
60
-
61
-
62
-
63
-
64
-
65
-
66
-
67
-
68
-
69
-
70
-
71
-
72
-
73
-
74
-
75
-
76
-
77
-
78
-
79
-
80
-
81
-
82
-
83
-
84
-
85
-
86
-
87
-
88
-
89
-
90
-
91
-
92
-
93
-
94
-
95
-
96
-
97
-
98
-
99
-
100
-
101
-
102
-
103
-
104
-
105
-
106
-
107
-
108
-
109
-
110
-
111
-
112
-
113
-
114
 |
 |

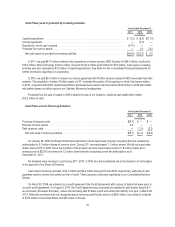
South Asia
Years Ended December 31, Percent Change
2011 2010 2009 2011 vs. 2010 2010 vs. 2009
(In millions)
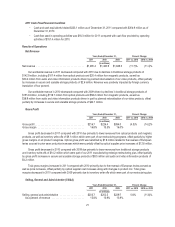
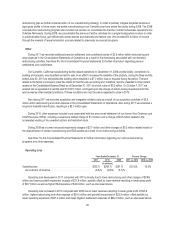
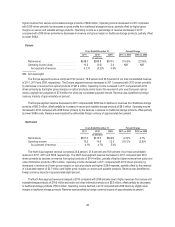
Net revenue ......................... $139.3 $143.0 $137.9 (2.6)% 3.7%
Operating income ..................... 4.0 4.0 2.6 —% 53.8%
As a percent of revenue .............. 2.9% 2.8% 1.9%
The South Asia segment revenue comprised 10.8 percent, 9.8 percent and 8.4 percent of our total consolidated revenue
in 2011, 2010 and 2009, respectively. The South Asia segment revenue decreased in 2011 compared with 2010 driven
primarily by decreases in revenue from optical products of $4.6 million and other traditional storage products of $2.8 million,
partially offset by higher revenue from audio and video information of $4.4 million. Operating income remained unchanged in
2011 compared with 2010, impacted by higher gross margins on audio and video information products offset by higher SG&A
costs. Revenue was benefited by foreign currency impacts of approximately six percent.
The South Asia segment revenue increased in 2010 compared with 2009 due to higher revenues from secure and
scalable storage products of $14.7 million and audio and video information products of $4.9 million, offset partially by
decreases in traditional storage products of $14.2 million. Operating income increased in 2010 compared with 2009 driven
primarily by higher gross margin percentages across all product categories, offset partially by increased SG&A costs.
Revenue was benefited by foreign currency impacts of approximately six percent.
Corporate and Unallocated
Years Ended December 31, Percent Change
2011 2010 2009 2011 vs. 2010 2010 vs. 2009
(In millions)
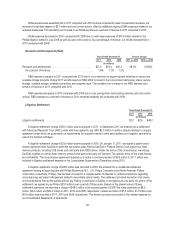
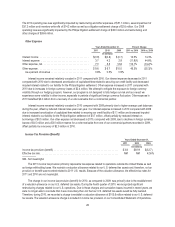
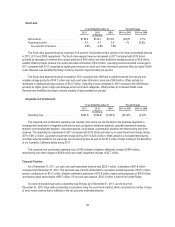
Operating loss ....................... $(68.3) $(124.8) $(130.3) (45.3)% (4.2)%
The corporate and unallocated operating loss includes costs which are not allocated to the business segments in
management’s evaluation of segment performance such as litigation settlement expense, goodwill impairment expense,
research and development expense, corporate expense, stock-based compensation expense and restructuring and other
expense. The operating loss decreased in 2011 compared with 2010 driven primarily by an asset impairment charge during
2010 of $31.2 million, a goodwill impairment charge during 2010 of $23.5 million, offset partially by increased restructuring
and other expense related to our previously announced programs as well as the $7.0 million charge relating to the demolition
of our Camarillo, California facility during 2011.
The corporate and unallocated operating loss in 2009 included a litigation settlement charge of $49.0 million,
restructuring and other charges of $26.6 million and asset impairment charges of $2.7 million.
Financial Position
As of December 31, 2011, our cash and cash equivalents balance was $223.1 million, a decrease of $81.8 million
compared with December 31, 2010. The decrease was primarily attributable to acquisition related payments of $47.0 million,
pension contributions of $14.2 million, litigation settlement payments of $10.9 million, restructuring payments of $16.9 million
and treasury stock repurchases of $9.7 million. Of our total cash balance, $135.3 million is held in the United States.
Accounts receivable days sales outstanding was 58 days as of December 31, 2011, up one day from
December 31, 2010. Days sales outstanding is calculated using the count-back method, which calculates the number of days
of most recent revenue that is reflected in the net accounts receivable balance.
29