Memorex 2011 Annual Report Download - page 20
Download and view the complete annual report
Please find page 20 of the 2011 Memorex annual report below. You can navigate through the pages in the report by either clicking on the pages listed below, or by using the keyword search tool below to find specific information within the annual report.-
 1
1 -
2
-
3
-
4
-
5
-
6
-
7
-
8
-
9
-
 10
10 -
 11
11 -
 12
12 -
 13
13 -
 14
14 -
 15
15 -
 16
16 -
 17
17 -
 18
18 -
 19
19 -
 20
20 -
 21
21 -
 22
22 -
 23
23 -
 24
24 -
 25
25 -
 26
26 -
 27
27 -
 28
28 -
 29
29 -
 30
30 -
31
-
32
-
33
-
34
-
35
-
36
-
37
-
38
-
39
-
40
-
41
-
42
-
43
-
44
-
45
-
46
-
47
-
48
-
49
-
50
-
51
-
52
-
53
-
54
-
55
-
56
-
57
-
58
-
59
-
60
-
61
-
62
-
63
-
64
-
65
-
66
-
67
-
68
-
69
-
70
-
71
-
72
-
73
-
74
-
75
-
76
-
77
-
78
-
79
-
80
-
81
-
82
-
83
-
84
-
85
-
86
-
87
-
88
-
89
-
90
-
91
-
92
-
93
-
94
-
95
-
96
-
97
-
98
-
99
-
100
-
101
-
102
-
103
-
104
-
105
-
106
-
107
-
108
-
109
-
110
-
111
-
112
-
113
-
114
 |
 |

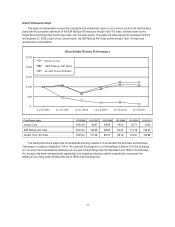
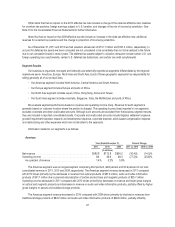
Stock Performance Graph
The graph and table below compare the cumulative total shareholder return on our common stock for the last five fiscal
years with the cumulative total return of the S&P MidCap 400 Index and ArcaEx Tech 100 Index, formerly known as the
Pacific Stock Exchange High Technology Index, over the same period. The graph and table assume the investment of $100
on December 31, 2006 in each of our common stock, the S&P MidCap 400 Index and the ArcaEx Tech 100 Index and
reinvestment of all dividends.
12/31/201112/31/201012/31/200912/31/200812/31/200712/31/2006
Imation Corp.
S&P Midcap 400 Index
ArcaEx Tech 100 Index
$-
$50
$100
$150
$200
$250
Shareholder Return Performance
(Total Return Index) 12/31/2006 12/31/2007 12/31/2008 12/31/2009 12/31/2010 12/31/2011
Imation Corp. ........................ $100.00 45.67 29.89 19.20 22.71 12.62
S&P Midcap 400 Index ................. $100.00 106.69 66.92 90.34 112.79 109.30
ArcaEx Tech 100 Index ................. $100.00 107.26 69.73 99.76 123.91 122.98
The stock performance graph shall not be deemed soliciting material or to be filed with the Securities and Exchange
Commission or subject to Regulation 14A or 14C under the Exchange Act or to the liabilities of Section 18 of the Exchange
Act, nor shall it be incorporated by reference into any past or future filing under the Securities Act of 1933 or the Exchange
Act, except to the extent we specifically request that it be treated as soliciting material or specifically incorporate it by
reference into a filing under the Securities Act of 1933 or the Exchange Act.
17