Lululemon 2011 Annual Report Download - page 70
Download and view the complete annual report
Please find page 70 of the 2011 Lululemon annual report below. You can navigate through the pages in the report by either clicking on the pages listed below, or by using the keyword search tool below to find specific information within the annual report.-
 1
1 -
2
-
3
-
4
-
5
-
6
-
7
-
8
-
9
-
10
-
11
-
12
-
13
-
14
-
15
-
16
-
17
-
18
-
19
-
20
-
21
-
22
-
23
-
24
-
25
-
26
-
27
-
28
-
29
-
30
-
31
-
32
-
33
-
34
-
35
-
36
-
37
-
38
-
39
-
40
-
41
-
42
-
43
-
44
-
45
-
46
-
47
-
48
-
49
-
50
-
51
-
52
-
53
-
54
-
55
-
56
-
57
-
58
-
59
-
 60
60 -
 61
61 -
 62
62 -
 63
63 -
 64
64 -
 65
65 -
 66
66 -
 67
67 -
 68
68 -
 69
69 -
 70
70 -
 71
71 -
 72
72 -
 73
73 -
 74
74 -
 75
75 -
 76
76 -
 77
77 -
 78
78 -
 79
79 -
 80
80 -
81
-
82
-
83
-
84
-
85
-
86
-
87
-
88
-
89
-
90
-
91
-
92
-
93
-
94
 |
 |

Table of Contents
data about exercise patterns of employees in the retail industry as well as considering the probability of a liquidity event such as the sale of the
Company or an IPO and the potential impact of such an event on the exercise pattern. The risk-free interest rate approximates the yield on
benchmark Government of Canada bonds for terms similar to the contract life of the options.
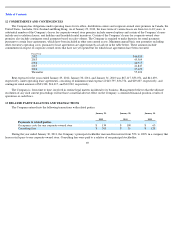
The total fair value of awards under the stockholder sponsored plans that vested during the years ended January 29, 2012, January 30, 2011
and January 31, 2010 was $nil, $261, and $464 , respectively.
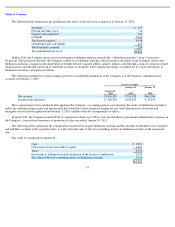
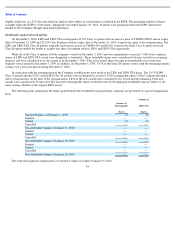
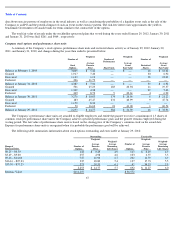
Company stock options and performance share units
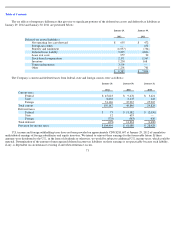
A summary of the Company’s stock options, performance share units and restricted shares activity as of January 29, 2012, January 30,
2011, and January 31, 2010, and changes during the years then ended is presented below:
The Company’s performance share units are awarded to eligible employees and entitle the grantee to receive a maximum of 1.5 shares of
common stock per performance share unit if the Company achieves specified performance goals and the grantee remains employed during the
vesting period. The fair value of performance share units is based on the closing price of the Company’s common stock on the award date.
Expense for performance share units is recognized when it is probable the performance goal will be achieved.
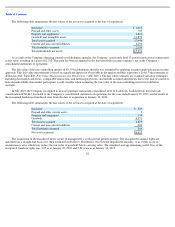
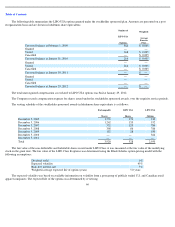
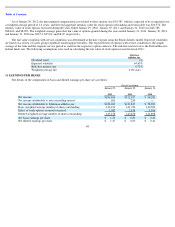
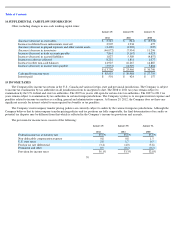
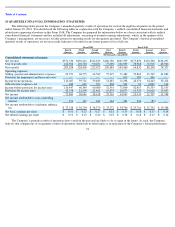
The following table summarizes information about stock options outstanding and exercisable at January 29, 2012:
67
Number of
Stock
Options
Weighted
-
Average
Exercise
Price
Number of
Performance
Share Units
Weighted
-
Average
Grant
Fair Value
Number of
Restricted
Shares
Weighted
-
Average
Grant
Fair Value
Balance at February 1, 2009
3,809
$
5.42
—
$
—
18
$
12.02
Granted
1,917
7.40
—
—
30
6.92
Exercised
1,113
1.12
—
—
18
12.02
Forfeited
226
11.79
—
—
—
—
Balance at January 31, 2010
4,387
$
7.04
—
$
—
30
$
6.92
Granted
501
25.23
183
20.94
11
19.37
Exercised
1,369
4.38
—
—
29
7.66
Forfeited
249
8.72
9
20.61
4
6.92
Balance at January 30, 2011
3,270
$
10.83
174
$
20.96
8
$
21.22
Granted
183
45.47
231
40.99
9
47.74
Exercised
1,150
8.36
—
—
—
—
Forfeited
50
16.62
21
41.00
1
60.54
Balance at January 29, 2012
2,253
$
14.77
384
$
31.90
16
$
33.96
Outstanding
Exercisable
Range of
Exercise Prices
Number of
Options
Weighted
-
Average
Exercise
Price
Weighted
-
Average
Remaining
Life (Years)
Number of
Options
Weighted
-
Average
Exercise
Price
Weighted
-
Average
Remaining
Life (Years)
$0.25 – $0.30
143
$
0.29
4.9
143
$
0.29
4.9
$3.49
–
$
9.00
655
4.98
4.6
103
6.55
5.5
$9.46
–
$
14.60
747
11.96
6.7
262
11.59
6.9
$16.16
–
$
25.23
335
18.80
5.4
137
17.73
5.5
$33.50
–
$
57.25
373
39.51
6.1
47
34.33
5.9
2,253
$
14.77
5.7
692
$
11.27
6.0
Intrinsic Value
$
111,207
$
36,572