Lululemon 2011 Annual Report Download - page 36
Download and view the complete annual report
Please find page 36 of the 2011 Lululemon annual report below. You can navigate through the pages in the report by either clicking on the pages listed below, or by using the keyword search tool below to find specific information within the annual report.-
 1
1 -
2
-
3
-
4
-
5
-
6
-
7
-
8
-
9
-
10
-
11
-
12
-
13
-
14
-
15
-
16
-
17
-
18
-
19
-
20
-
21
-
22
-
23
-
24
-
25
-
 26
26 -
 27
27 -
 28
28 -
 29
29 -
 30
30 -
 31
31 -
 32
32 -
 33
33 -
 34
34 -
 35
35 -
 36
36 -
 37
37 -
 38
38 -
 39
39 -
 40
40 -
 41
41 -
 42
42 -
 43
43 -
 44
44 -
 45
45 -
 46
46 -
47
-
48
-
49
-
50
-
51
-
52
-
53
-
54
-
55
-
56
-
57
-
58
-
59
-
60
-
61
-
62
-
63
-
64
-
65
-
66
-
67
-
68
-
69
-
70
-
71
-
72
-
73
-
74
-
75
-
76
-
77
-
78
-
79
-
80
-
81
-
82
-
83
-
84
-
85
-
86
-
87
-
88
-
89
-
90
-
91
-
92
-
93
-
94
 |
 |

Table of Contents
We expect selling, general and administrative expenses to increase throughout fiscal 2012 as we add administrative and sales personnel
and increase our infrastructure to support the growth in our store base.
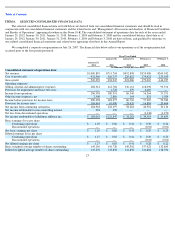
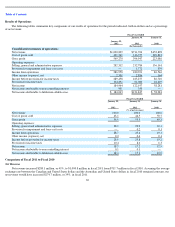
Income from Operations
Income from operations increased $106.6 million, or 59%, to $287.0 million in fiscal 2011 from $180.4 million in fiscal 2010. The
increase was a result of increased gross profit of $174.3 million, partially offset by increased selling, general and administrative costs of
$67.8 million. The increase in selling, general and administrative costs was primarily driven by the increase in our business, as seen in our net
revenue increases.
On a segment basis, we determine income from operations without taking into account our general corporate expenses. We have reviewed
our general corporate expenses and determined some costs previously classified as general corporate are direct segment expenses. Accordingly,
all prior year comparable information has be reclassified to conform to the current year classification.
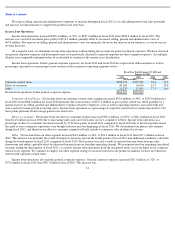
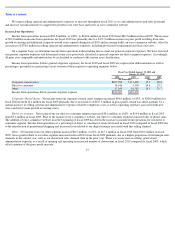
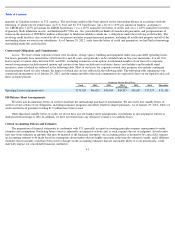
Income from operations (before general corporate expenses) for fiscal 2011 and fiscal 2010 are expressed in dollar amounts as well as
percentages, presented as a percentage of net revenue of their respective operating segments below.
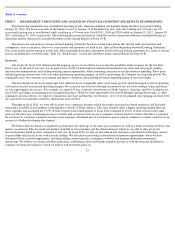
Corporate-Owned Stores. Net income from our corporate-owned stores segment increased $91.0 million, or 44%, to $299.0 million for
fiscal 2011 from $208.0 million for fiscal 2010 primarily due to an increase of $137.2 million in gross profit, which was offset partially by a
natural increase in selling, general and administrative expenses related to employee costs as well as operating expenses associated with new
stores and net revenue growth at existing stores. Income from operations as a percentage of corporate-owned stores revenue increased by 140
basis points primarily from leverage gained over fixed costs.
Direct to consumer. Net income from our direct to consumer segment increased $30.2 million, or 215%, to $44.2 million in fiscal 2011
from $14.0 million in fiscal 2010 due to increasing traffic and conversion rates on our e-commerce website. Income from operations as a
percentage of direct to consumer revenue increased by 1710 basis points in fiscal 2011 compared to fiscal 2010 due to decreased professional
fees paid as our e-commerce operations were brought in-house near the beginning of fiscal 2011. We discontinued our phone sales channel
during fiscal 2011, and therefore our direct to consumer segment will only include e-commerce sales in future fiscal years.
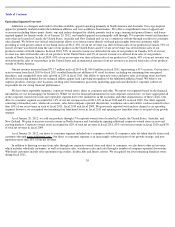
Other. Net income from our other segment increased $4.2 million, or 24%, to $21.2 million in fiscal 2011 from $17.1 million in fiscal
2010. This increase was primarily the result of temporary locations open in the fourth quarter of fiscal 2011 and additional warehouse sales held
during the fourth quarter of fiscal 2011 compared to fiscal 2010. This increase was also a result of increased income from strategic sales,
showrooms and outlets, partially offset by decreased income from our franchise operating channel. We reacquired our four remaining franchised
locations during the third quarter of fiscal 2011; as a result, income from operations from the reacquired stores is now included in our corporate-
owned stores segment. We continue to employ our other segment strategy to increase interest in our product in markets we have not otherwise
entered with corporate-owned stores.
Income from operations also includes general corporate expenses. General corporate expenses increased $18.7 million, or 32%, to
$77.4 million in fiscal 2011 from $58.7 million in fiscal 2010. This increase was
33
Fiscal Year Ended January 29, 2012 and
January 30, 2011
2011
2010
2011
2010
(In thousands)
(Percentages)
Corporate
-
owned stores
$
298,974
$
207,992
36.6
35.2
Direct to consumer
44,168
14,016
41.5
24.4
Other
21,225
17,059
27.5
26.9
Income from operations before general corporate expense
$
364,367
$
239,067