Lululemon 2011 Annual Report Download - page 55
Download and view the complete annual report
Please find page 55 of the 2011 Lululemon annual report below. You can navigate through the pages in the report by either clicking on the pages listed below, or by using the keyword search tool below to find specific information within the annual report.-
 1
1 -
2
-
3
-
4
-
5
-
6
-
7
-
8
-
9
-
10
-
11
-
12
-
13
-
14
-
15
-
16
-
17
-
18
-
19
-
20
-
21
-
22
-
23
-
24
-
25
-
26
-
27
-
28
-
29
-
30
-
31
-
32
-
33
-
34
-
35
-
36
-
37
-
38
-
39
-
40
-
41
-
42
-
43
-
44
-
 45
45 -
 46
46 -
 47
47 -
 48
48 -
 49
49 -
 50
50 -
 51
51 -
 52
52 -
 53
53 -
 54
54 -
 55
55 -
 56
56 -
 57
57 -
 58
58 -
 59
59 -
 60
60 -
 61
61 -
 62
62 -
 63
63 -
 64
64 -
 65
65 -
66
-
67
-
68
-
69
-
70
-
71
-
72
-
73
-
74
-
75
-
76
-
77
-
78
-
79
-
80
-
81
-
82
-
83
-
84
-
85
-
86
-
87
-
88
-
89
-
90
-
91
-
92
-
93
-
94
 |
 |

Table of Contents
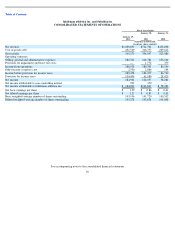
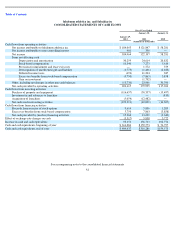
lululemon athletica inc. and Subsidiaries
CONSOLIDATED STATEMENTS OF CASH FLOWS
See accompanying notes to the consolidated financial statements
52
Fiscal Year Ended
January 29,
2012
January 30,
2011
January 31,
2010
(Amounts in thousands)
Cash flows from operating activities
Net income attributable to lululemon athletica inc
$
184,063
$
121,847
$
58,281
Net income attributable to non
-
controlling interest
901
350
—
Net income
184,964
122,197
58,281
Items not affecting cash
Depreciation and amortization
30,259
24,614
20,832
Stock
-
based compensation
10,340
7,273
5,616
Provision for impairment and lease exit costs
—
1,772
379
Derecognition of unredeemed gift card liability
(1,775
)
(1,406
)
(2,183
)
Deferred income taxes
(693
)
11,234
387
Excess tax benefits from stock
-
based compensation
(5,750
)
(7,863
)
3,858
Gain on investment
—
(
1,792
)
—
Other, including net changes in other non
-
cash balances
(13,730
)
23,966
30,790
Net cash provided by operating activities
203,615
179,995
117,960
Cash flows from investing activities
Purchase of property and equipment
(116,657
)
(30,357
)
(15,497
)
Investment in and advances to franchise
—
—
(
810
)
Acquisition of franchises
(5,654
)
(12,482
)
—
Net cash used in investing activities
(122,311
)
(42,839
)
(16,307
)
Cash flows from financing activities
Proceeds from exercise of stock options
9,614
5,836
1,209
Excess tax benefits from stock
-
based compensation
5,750
7,863
(3,858
)
Net cash provided by (used in) financing activities
15,364
13,699
(2,649
)
Effect of exchange rate changes on cash
(3,517
)
5,858
3,772
Increase in cash and cash equivalents
93,151
156,713
102,776
Cash and cash equivalents, beginning of year
$
316,286
$
159,573
$
56,797
Cash and cash equivalents, end of year
$
409,437
$
316,286
$
159,573