Lululemon 2011 Annual Report Download - page 39
Download and view the complete annual report
Please find page 39 of the 2011 Lululemon annual report below. You can navigate through the pages in the report by either clicking on the pages listed below, or by using the keyword search tool below to find specific information within the annual report.-
 1
1 -
2
-
3
-
4
-
5
-
6
-
7
-
8
-
9
-
10
-
11
-
12
-
13
-
14
-
15
-
16
-
17
-
18
-
19
-
20
-
21
-
22
-
23
-
24
-
25
-
26
-
27
-
28
-
 29
29 -
 30
30 -
 31
31 -
 32
32 -
 33
33 -
 34
34 -
 35
35 -
 36
36 -
 37
37 -
 38
38 -
 39
39 -
 40
40 -
 41
41 -
 42
42 -
 43
43 -
 44
44 -
 45
45 -
 46
46 -
 47
47 -
 48
48 -
 49
49 -
50
-
51
-
52
-
53
-
54
-
55
-
56
-
57
-
58
-
59
-
60
-
61
-
62
-
63
-
64
-
65
-
66
-
67
-
68
-
69
-
70
-
71
-
72
-
73
-
74
-
75
-
76
-
77
-
78
-
79
-
80
-
81
-
82
-
83
-
84
-
85
-
86
-
87
-
88
-
89
-
90
-
91
-
92
-
93
-
94
 |
 |

Table of Contents
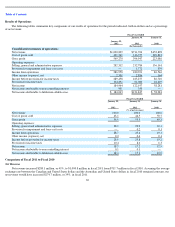
The increase in gross profit was partially offset by increases in fixed costs, such as occupancy costs and depreciation, as well as increased
costs related to our design, production, distribution and merchandising departments.
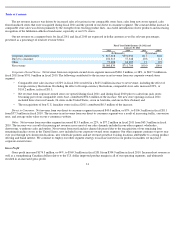
Gross profit, as a percentage of net revenue, or gross margin, increased 620 basis points, to 55.5% in fiscal 2010 from 49.3% in fiscal
2009. The increase in gross margin resulted primarily from:
Selling, General and Administrative Expenses
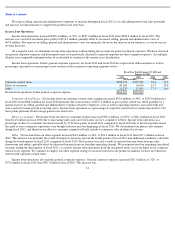
Selling, general and administrative expenses, including provision for impairment and lease exit costs, increased $78.0 million, or 57%, to
$214.6 million in fiscal 2010 from $136.5 million in fiscal 2009. The $78.0 million increase in selling, general and administrative expenses was
principally comprised of:
As a percentage of net revenue, selling, general and administrative expenses were 30.1% in both fiscal 2010 and fiscal 2009.
36
•
a decrease in fixed costs, such as occupancy costs and depreciation, relative to the increase in net revenue, which had a leveraging
effect on gross margin and contributed to an increase in gross margin of 250 basis points;
•
an increase in product margins in corporate-
owned stores, direct to consumer and other segments, which contributed to an increase in
gross margin of 180 basis points primarily as a result of improved product costing on our spring, summer, and fall assortment of
merchandise and a higher proportion of total sales coming from our direct to consumer segment;
•
strengthening of the Canadian dollar, relative to the U.S. dollar, decreased foreign exchange impacts on product costs and contributed
to an increase in gross margin of 140 basis points; and
•
a decrease in costs related to design, production, distribution and merchandising, relative to the increase in net revenue, which had a
leveraging effect on gross margin and contributed to an increase in gross margin of 50 basis points.
•
an increase in employee costs of $24.8 million as we experience natural growth in labor hours associated with new corporate-owned
stores, showrooms, outlets and other, and growth at existing locations;
•
an increase in variable administrative costs of $18.4 million related to our direct to consumer segment, primarily associated with
revenue growth in our e
-
commerce website sales channel;
•
an increase in other costs, including occupancy costs, depreciation, distribution and provision for impairment and lease exist costs not
included in cost of goods sold, of $14.5 million as a result of the expansion of our business;
•
an increase in head office employee costs, including stock-based compensation expense and management incentive-based
compensation, of $9.6 million incurred in order to position us for long
-
term growth;
•
an increase in administrative costs of $6.5 million related to our Australian business, in which we increased our investment
significantly in the second quarter of fiscal 2010, which we now report on a consolidated basis;
•
an increase in marketing efforts, including initiatives associated with the Olympic games, of $3.3 million to increase our brand
awareness in both new and existing markets; and
•
an increase in professional fees of $0.9 million which includes consulting fees for recruiting, store development and information
systems, legal fees associated with reacquisition of franchise rights, and employment matters.