LG 2011 Annual Report Download - page 45
Download and view the complete annual report
Please find page 45 of the 2011 LG annual report below. You can navigate through the pages in the report by either clicking on the pages listed below, or by using the keyword search tool below to find specific information within the annual report.-
 1
1 -
2
-
3
-
4
-
5
-
6
-
7
-
8
-
9
-
10
-
11
-
12
-
13
-
14
-
15
-
16
-
17
-
18
-
19
-
20
-
21
-
22
-
23
-
24
-
25
-
26
-
27
-
28
-
29
-
30
-
31
-
32
-
33
-
34
-
 35
35 -
 36
36 -
 37
37 -
 38
38 -
 39
39 -
 40
40 -
 41
41 -
 42
42 -
 43
43 -
 44
44 -
 45
45 -
 46
46
 |
 |
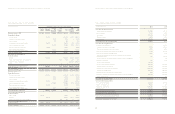
Years ended December 31, 2011 and 2010 Years ended December 31, 2011 and 2010
LG Electronics Consolidated Statements of Changes in Equity
LG Electronics Consolidated Statements of Cash Flows
(in millions of Korean Won) Attributable to equity holders of the Parent Company
Paid-in
Capital
Retained
Earnings
Accumulated
Other
Comprehensive
Income (loss)
Other
Components
of Equity
Total
Non-
controlling
Interest
Total
Equity
Balance at January 1, 2010 3,017,088 9,214,309 (156,886) (270,333) 11,804,178 621,068 12,425,246
Comprehensive Income
Profit for the year - 1,226,962 - - 1,226,962 55,157 1,282,119
Available-for-sale financial assets - - (1,262) - (1,262) 0 (1,262)
Cash flow hedges - - (38) - (38) - (38)
Actuarial gain on defined benefit liability - (46,681) - - (46,681) (51) (46,732)
Currency translation differences - - (31,458) - (31,458) (853) (32,311)
Share of actuarial loss of associates - (3,692) - - (3,692) - (3,692)
Other comprehensive expense of
jointly controlled entities and associates - - (20,200) - (20,200) - (20,200)
Total comprehensive income - 1,176,589 (52,958) - 1,123,631 54,253 1,177,884
Transactions with equity holders of
the Parent Company
Dividends - (282,725) - - (282,725) (24,900) (307,625)
Change in ownership interest over subsidiaries - - - (957) (957) 4,833 3,876
Changes in scope of subsidiaries - - - - - (439,757) (439,757)
Others - - - 13 13 - 13
Total transactions with equity holders of
the Parent Company - (282,725) - (944) (283,669) (459,824) (743,493)
Balance at December 31, 2010 3,017,088 10,108,173 (209,844) (271,277) 12,644,140 215,497 12,859,637
Balance at January 1, 2011 3,017,088 10,108,173 (209,844) (271,277) 12,644,140 215,497 12,859,637
Comprehensive income
Profit (loss) for the year - (469,624) - - (469,624) 36,819 (432,805)
Available-for-sale financial assets - - (3,474) - (3,474) - (3,474)
Cash flow hedges - - (4,717) - (4,717) - (4,717)
Actuarial loss on defined benefit liability - (94,056) - - (94,056) - (94,056)
Currency translation differences - - (130,808) - (130,808) 13,175 (117,633)
Share of actuarial loss of associates - (11,887) - - (11,887) - (11,887)
Other comprehensive income of
jointly controlled entities and associates - - 22,259 - 22,259 - 22,259
Total comprehensive income (loss) - (575,567) (116,740) - (692,307) 49,994 (642,313)
Transactions with equity holders of
the Parent Company :
Paid-in-Capital 975,260 - - - 975,260 - 975,260
Dividends - (33,072) - - (33,072) (11,381) (44,453)
Change in ownership interest over subsidiaries - - - (62) (62) 179 117
Total transactions with equity holders of
the Parent Company 975,260 (33,072) - (62) 942,126 (11,202) 930,924
Balance at December 31, 2011 3,992,348 9,499,534 (326,584) (271,339) 12,893,959 254,289 13,148,248
(in millions of Korean Won) 2011 2010
Cash flows from operating activities
Cash generated from operations 2,240,468 490,119
Interest received 74,412 67,972
Interest paid (310,460) (232,253)
Dividends received 84,859 76,301
Income tax paid (359,212) (393,622)
Net cash generated from operating activities 1,730,067 8,517
Cash flows from investing activities
Decrease in financial deposits - 195,835
Decrease in loans and other receivables 148,705 221,406
Proceeds from disposal of other financial assets 38,303 98,081
Proceeds from disposal of property, plant and equipment 77,780 321,739
Proceeds from disposal of intangible assets 15,954 2,618
Proceeds from disposal of and recovery of investments in jointly controlled
entities and associates 866 210,336
Increase in cash and cash equivalents due to changes in scope of subsidiaries - 798
Decrease in other assets 4,155 9,375
Increase in financial deposits (77,352) -
Increase in loans and other receivables (212,227) (183,362)
Acquisition of other financial assets (91,989) (144,137)
Acquisition of property, plant and equipment (1,830,008) (1,745,219)
Acquisition of intangible assets (319,850) (287,549)
Acquisition of jointly controlled entities and associates (998) (129,693)
Decrease in cash and cash equivalents due to changes in scope of subsidiaries (205,254) (239,632)
Increase in other assets - (399)
Net cash used in investing activities (2,451,915) (1,669,803)
Cash flows from financing activities
Proceeds from borrowings 3,020,490 3,276,962
Issuance of ordinary shares 975,461 1,301
Repayments of borrowings (2,792,295) (1,749,208)
Dividends paid (43,143) (308,292)
Net cash provided by financing activities 1,160,513 1,220,763
Exchange losses on cash, cash equivalents (37,362) (39,102)
Net increase (decrease) in cash, cash equivalents 401,303 (479,625)
Cash and cash equivalents at the beginning of year 1,944,162 2,423,787
Cash and cash equivalents at the end of year 2,345,465 1,944,162
81
80