LG 2011 Annual Report Download - page 43
Download and view the complete annual report
Please find page 43 of the 2011 LG annual report below. You can navigate through the pages in the report by either clicking on the pages listed below, or by using the keyword search tool below to find specific information within the annual report.-
 1
1 -
2
-
3
-
4
-
5
-
6
-
7
-
8
-
9
-
10
-
11
-
12
-
13
-
14
-
15
-
16
-
17
-
18
-
19
-
20
-
21
-
22
-
23
-
24
-
25
-
26
-
27
-
28
-
29
-
30
-
31
-
32
-
 33
33 -
 34
34 -
 35
35 -
 36
36 -
 37
37 -
 38
38 -
 39
39 -
 40
40 -
 41
41 -
 42
42 -
 43
43 -
 44
44 -
 45
45 -
 46
46
 |
 |

December 31, 2011 and 2010 December 31, 2011 and 2010
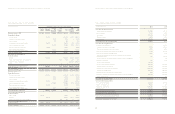
LG Electronics Consolidated Statements of Financial Position
LG Electronics Consolidated Statements of Financial Position
(in millions of Korean Won) December 31, 2011 December 31, 2010
Assets
Current assets
Cash and cash equivalents 2,345,465 1,944,162
Financial deposits 150,000 85,000
Trade receivables 6,752,559 7,001,962
Loans and other receivables 494,239 525,046
Other financial assets 1,677 1,814
Inventories 4,947,160 5,872,420
Current income tax assets 197,968 154,286
Other current assets 890,388 924,813
Assets classified as held for sale 3,670 5,030
15,783,126 16,514,533
Non-Current Assets
Financial deposits 129,439 105,479
Loans and other receivables 610,709 543,562
Other financial assets 139,282 105,601
Property, plant and equipment 7,290,413 6,500,484
Intangible assets 1,035,797 763,382
Deferred income tax assets 1,246,071 968,751
Investments in jointly controlled entities and associates 5,603,199 6,008,145
Investment property 7,239 7,295
Other non-current assets 813,182 801,267
16,875,331 15,803,966
Total assets 32,658,457 32,318,499
(in millions of Korean Won) December 31, 2011 December 31, 2010
Liabilities
Current liabilities
Trade payables 5,486,871 5,824,392
Borrowings 3,178,212 4,009,229
Other payables 3,780,158 3,730,292
Other financial liabilities 13,860 5,314
Current income tax liabilities 81,643 98,659
Provisions 724,516 748,146
Other current liabilities 949,262 901,201
14,214,522 15,317,233
Non-current liabilities
Borrowings 4,257,406 3,183,706
Other payables 20,490 11,597
Other financial liabilities 378 37,492
Deferred income tax liabilities 15,237 10,253
Defined benefit liability 423,306 318,112
Provisions 575,632 577,697
Other non-current liabilities 3,238 2,772
5,295,687 4,141,629
Total liabilities 19,510,209 19,458,862
Equity attributable to owners of the Parent Company
Paid-in capital:
Capital stock 904,169 809,169
Share premium 3,088,179 2,207,919
Retained earnings 9,499,534 10,108,173
Accumulated other comprehensive loss (326,584) (209,844)
Other components of equity (271,339) (271,277)
12,893,959 12,644,140
Non-controlling interest 254,289 215,497
Total equity 13,148,248 12,859,637
Total liabilities and equity 32,658,457 32,318,499
77
76