LG 2011 Annual Report Download - page 38
Download and view the complete annual report
Please find page 38 of the 2011 LG annual report below. You can navigate through the pages in the report by either clicking on the pages listed below, or by using the keyword search tool below to find specific information within the annual report.-
 1
1 -
2
-
3
-
4
-
5
-
6
-
7
-
8
-
9
-
10
-
11
-
12
-
13
-
14
-
15
-
16
-
17
-
18
-
19
-
20
-
21
-
22
-
23
-
24
-
25
-
26
-
27
-
 28
28 -
 29
29 -
 30
30 -
 31
31 -
 32
32 -
 33
33 -
 34
34 -
 35
35 -
 36
36 -
 37
37 -
 38
38 -
 39
39 -
 40
40 -
 41
41 -
 42
42 -
 43
43 -
 44
44 -
 45
45 -
 46
46
 |
 |

67
66
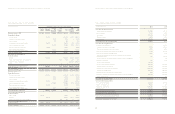
Equipment Investment
1,812
R&D Investment
2,483
Total
4,295
Korea
35,284
Overseas
56,173
Total
91,457
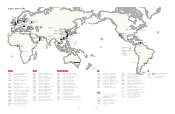
FACT & FIGURES As of 2011_ In Billions of Korean Won
Global revenue, referring to the total revenue of the global subsidiaries’ accounts excluding internal transactions.
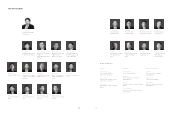
COO
CTO
CFO
CHO
Business Support Officer
GMO
Smart Business Center
Corporate Design Center
Quality Center
Corporate Strategic Planning Division
Corporate Business Planning Division
Corporate Audit Division
•
H
o
m
e
E
n
t
e
r
t
a
i
n
m
e
n
t
•
M
o
b
i
l
e
C
o
m
m
u
n
i
c
a
t
i
o
n
s
•
H
o
m
e
A
p
p
l
i
a
n
c
e
•
A
i
r
C
o
n
d
i
t
i
o
n
i
n
g
&
E
n
e
r
g
y
S
o
l
u
t
i
o
n
•
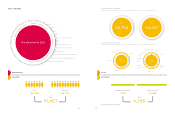
As of 2011_ In Billions of Korean Won
Vice Chairman & CEO
ORGANIZATION SALES
EMPLOYEES INVESTMENT
2010
55,754
2011
54,257
As of 2011_ In Billions of Korean Won
Global revenue, referring to the total revenue of the global subsidiaries’ accounts excluding internal transactions.
Japan 2%
Korea 14%
Europe 15%
North
America
23%
China 5%
Central &
South America
15%
CIS 6%
India 5%
South East
Asia 6%
Middle East
& Africa
10%
Sales by
Region
HE 44%
HA 20%
MC 22%
AE 8%
Others 6%
Sales by
Company