LG 2011 Annual Report Download - page 44
Download and view the complete annual report
Please find page 44 of the 2011 LG annual report below. You can navigate through the pages in the report by either clicking on the pages listed below, or by using the keyword search tool below to find specific information within the annual report.-
 1
1 -
2
-
3
-
4
-
5
-
6
-
7
-
8
-
9
-
10
-
11
-
12
-
13
-
14
-
15
-
16
-
17
-
18
-
19
-
20
-
21
-
22
-
23
-
24
-
25
-
26
-
27
-
28
-
29
-
30
-
31
-
32
-
33
-
 34
34 -
 35
35 -
 36
36 -
 37
37 -
 38
38 -
 39
39 -
 40
40 -
 41
41 -
 42
42 -
 43
43 -
 44
44 -
 45
45 -
 46
46
 |
 |

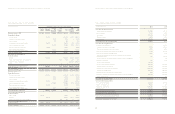
Years ended December 31, 2011 and 2010 Years ended December 31, 2011 and 2010
LG Electronics Consolidated Statements of Operations
LG Electronics Consolidated Statements of Comprehensive Income
(in millions of Korean Won, except per share amounts) 2011 2010
Continuing operations
Net sales 54,256,585 55,753,804
Cost of sales 42,057,595 43,453,096
Gross profit 12,198,990 12,300,708
Selling and marketing expenses 7,201,413 7,534,431
Administrative expenses 1,359,986 1,402,203
Research and development expenses 1,698,917 1,500,792
Service costs 1,595,453 1,775,128
Other operating income 1,622,901 2,009,968
Other operating expenses 1,685,859 1,921,653
Operating income 280,263 176,469
Financial income 574,148 819,747
Financial expenses 922,666 1,039,012
Income (expense) from jointly controlled entities and associates (331,058) 477,322
Profit (loss) before income tax (399,313) 434,526
Income tax expense 33,492 141
Profit (loss) from continuing operations (432,805) 434,385
Discontinued operations
Profit from discontinued operations - 847,734
Profit (loss) for the year (432,805) 1,282,119
Profit (loss) for the year attributable to:
Equity holders of the Parent Company (469,624) 1,226,962
Profit (loss) for the year from continuing operations (469,624) 393,713
Profit for the year from discontinued operations - 833,249
Non-controlling interest 36,819 55,157
Profit for the year from continuing operations 36,819 40,672
Profit for the year from discontinued operations - 14,485
Earnings per share attributable to the equity holders of
the Parent Company during the year (in Won)
Earnings per share for profit attributable to
the ordinary equity holders of the company (2,880) 7,419
Earnings (loss) per share for profit from continuing operations (2,880) 2,381
Earnings per share for profit from discontinued operations - 5,038
Earnings (loss) per share for profit attributable to
the preferred equity holders of the company (2,563) 7,662
Earnings (loss) per share for profit from continuing operations (2,563) 2,459
Earnings per share for profit from discontinued operations - 5,203
(in millions of Korean Won) 2011 2010
Profit (loss) for the year (432,805) 1,282,119
Other comprehensive income (loss):
Available-for-sale financial assets (3,474) (1,262)
Cash flow hedges (4,717) (38)
Actuarial loss on defined benefit liability (94,056) (46,732)
Currency translation differences (117,633) (32,311)
Share of actuarial loss of associates (11,887) (3,692)
Other comprehensive income (loss) from jointly controlled
entities and associates 22,259 (20,200)
Other comprehensive lossfor the year, net of tax (209,508) (104,235)
Total comprehensive income (loss) for the year (642,313) 1,177,884
Comprehensive income (loss) for the year attributable to:
Equity holders of the Parent Company (692,307) 1,123,631
Non-controlling interest 49,994 54,253
Total comprehensive income (loss) for the year (642,313) 1,177,884
79
78