LG 2010 Annual Report Download - page 41
Download and view the complete annual report
Please find page 41 of the 2010 LG annual report below. You can navigate through the pages in the report by either clicking on the pages listed below, or by using the keyword search tool below to find specific information within the annual report.-
 1
1 -
2
-
3
-
4
-
5
-
6
-
7
-
8
-
9
-
10
-
11
-
12
-
13
-
14
-
15
-
16
-
17
-
18
-
19
-
20
-
21
-
22
-
23
-
24
-
25
-
26
-
27
-
28
-
29
-
30
-
 31
31 -
 32
32 -
 33
33 -
 34
34 -
 35
35 -
 36
36 -
 37
37 -
 38
38 -
 39
39 -
 40
40 -
 41
41 -
 42
42
 |
 |
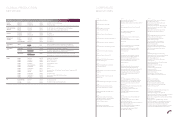
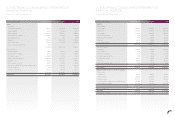
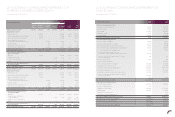
LG ELECTRONICS CONSOLIDATED STATEMENTS OF
CHANGES IN SHAREHOLDERS’ EQUITY
Years ended December 31, 2010 and 2009
LG ELECTRONICS CONSOLIDATED STATEMENTS OF
CASH FLOWS
Years ended December 31, 2010 and 2009
(in millions of Korean Won) 2010 2009
Cash flows from operating activities
Cash generated from operations 490,119 6,829,790
Interest received 67,972 84,079
Interest paid (232,253) (412,967)
Dividends received 76,301 151,144
Income tax paid (393,622) (502,497)
Net cash generated from operating activities 8,517 6,149,549
Cash flows from investing activities
Decrease in financial deposits 195,835 26,071
Decrease in loans and other receivables 221,406 206,654
Proceeds from disposal of other financial assets 98,081 130,998
Proceeds from disposal of property, plant and equipment 321,739 258,188
Proceeds from disposal of intangible assets 2,618 10,097
Proceeds from disposal of and recovery of
investments in jointly controlled entities and associates 210,336 -
Increase in cash and cash equivalents due to changes
in scope of subsidiaries 798 821
Decrease in other assets 9,375 498
Increase in financial deposits - (173,000)
Increase in loans and other receivables (183,362) (201,654)
Acquisition of other financial assets (144,137) (278,137)
Acquisition of property, plant and equipment (1,745,219) (1,591,188)
Acquisition of intangible assets (287,549) (260,943)
Acquisition of jointly controlled entities and associates (129,693) (116,930)
Decrease in cash and cash equivalents due to changes
in scope of subsidiaries (239,632) -
Increase in other assets (399) (4,580)
Net cash used in investing activities (1,669,803) (1,993,105)
Cash flows from financing activities
Proceeds from borrowings 3,276,962 2,035,881
Issuance of ordinary shares 1,301 -
Repayments of borrowings (1,749,208) (6,171,387)
Dividends paid (308,292) (70,764)
Acquisition of treasury shares - (321)
Acquisition of non-controlling interest - (1,188)
Net cash provided by (used in) financing activities 1,220,763 (4,207,779)
Exchange losses on cash, cash equivalents (39,102) (84,913)
Net decrease in cash, cash equivalents (479,625) (136,248)
Cash and cash equivalents at the beginning of year 2,423,787 2,560,035
Cash and cash equivalents at the end of year 1,944,162 2,423,787
Paid-in
Capital
Retained
Earnings
Accumulated
Other
Comprehensive
Income
Other
Components
of Equity Total
Non-
controlling
Interest
Total
Equity
Balance at January 1, 2009 3,017,088 7,005,588 9,070 (269,712) 9,762,034 600,620 10,362,654
Comprehensive income
Profit for the year - 2,287,485 - - 2,287,485 62,643 2,350,128
Actuarial gain on defined benefit liability - (10,455) - - (10,455) (5,403) (15,858)
Share of actuarial loss of associates - (11,077) - - (11,077) - (11,077)
Other comprehensive expense of
jointly controlled entities and associates - - (22,452) - (22,452) - (22,452)
Cash flow hedges - - 382 - 382 - 382
Available-for-sale financial assets - - 7,106 - 7,106 348 7,454
Currency translation differences - - (150,992) - (150,992) (21,506) (172,498)
Total comprehensive income - 2,265,953 (165,956) - 2,099,997 36,082 2,136,079
Transactions with equity holders of
the Parent Company :
Dividends - (57,232) - - (57,232) (19,496) (76,728)
Change in ownership
interest over subsidiaries - - - (1,080) (1,080) 3,862 2,782
Others - - - 459 459 - 459
Total transactions with equity holders of
the Parent Company - (57,232) - (621) (57,853) (15,634) (73,487)
Balance at December 31, 2009 3,017,088 9,214,309 (156,886) (270,333) 11,804,178 621,068 12,425,246
Balance at January 1, 2010 3,017,088 9,214,309 (156,886) (270,333) 11,804,178 621,068 12,425,246
Comprehensive income
Profit for the year - 1,226,962 - - 1,226,962 55,157 1,282,119
Actuarial loss on defined benefit liability - (46,681) - - (46,681) (51) (46,732)
Share of actuarial loss of associates - (3,692) - - (3,692) - (3,692)
Other comprehensive expense of
jointly controlled entities and associates - - (20,200) - (20,200) - (20,200)
Cash flow hedges - - (38) - (38) - (38)
Available-for-sale financial assets - - (1,262) - (1,262) - (1,262)
Currency translation differences - - (31,458) - (31,458) (853) (32,311)
Total comprehensive income (loss) - 1,176,589 (52,958) - 1,123,631 54,253 1,177,884
Transactions with equity holders of
the Parent Company :
Dividends - (282,725) - - (282,725) (24,900) (307,625)
Change in ownership interest
over subsidiaries - - - (957) (957) 4,833 3,876
Changes in scope of subsidiaries - - - - - (439,757) (439,757)
Others - - - 13 13 - 13
Total transactions with equity holders of
the Parent Company - (282,725) - (944) (283,669) (459,824) (743,493)
Balance at December 31, 2010 3,017,088 10,108,173 (209,844) (271,277) 12,644,140 215,497 12,859,637
Attributable to equity holders of the Parent Company
(in millions of Korean Won)
78 79