LG 2010 Annual Report Download - page 39
Download and view the complete annual report
Please find page 39 of the 2010 LG annual report below. You can navigate through the pages in the report by either clicking on the pages listed below, or by using the keyword search tool below to find specific information within the annual report.-
 1
1 -
2
-
3
-
4
-
5
-
6
-
7
-
8
-
9
-
10
-
11
-
12
-
13
-
14
-
15
-
16
-
17
-
18
-
19
-
20
-
21
-
22
-
23
-
24
-
25
-
26
-
27
-
28
-
 29
29 -
 30
30 -
 31
31 -
 32
32 -
 33
33 -
 34
34 -
 35
35 -
 36
36 -
 37
37 -
 38
38 -
 39
39 -
 40
40 -
 41
41 -
 42
42
 |
 |

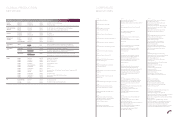
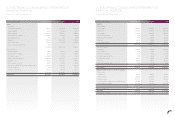
LG ELECTRONICS CONSOLIDATED STATEMENTS OF
FINANCIAL POSITION
December 31, 2010 and 2009, and January 1, 2009
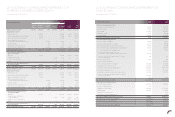
LG ELECTRONICS CONSOLIDATED STATEMENTS OF
FINANCIAL POSITION
December 31, 2010 and 2009, and January 1, 2009
(in millions of Korean Won) December 31, 2010 December 31, 2009 January 1, 2009
Liabilities
Current liabilities
Trade payables 5,824,392 5,315,853 4,021,262
Borrowings 4,009,229 4,307,015 8,437,731
Other payables 3,730,292 4,269,470 3,979,227
Other financial liabilities 5,314 62,153 61,225
Current income tax liabilities 98,659 144,230 250,032
Provisions 824,766 814,859 641,935
Other current liabilities 901,201 1,255,087 735,024
15,393,853 16,168,667 18,126,436
Non-current liabilities
Borrowings 3,183,706 2,601,583 2,684,540
Other payables 11,597 13,999 7,616
Other financial liabilities 37,492 80,222 129,416
Deferred income tax liabilities 10,253 25,682 6,133
Defined benefit liability 318,112 299,406 277,590
Provisions 501,077 495,981 158,827
Other non-current liabilities 2,772 3,726 28,672
4,065,009 3,520,599 3,292,794
Total liabilities 19,458,862 19,689,266 21,419,230
Equity attributable to owners of the Parent Company
Paid-in capital:
Capital stock 809,169 809,169 809,169
Share premium 2,207,919 2,207,919 2,207,919
Retained earnings 10,108,173 9,214,309 7,005,588
Accumulated other comprehensive income(expense) (209,844) (156,886) 9,070
Other components of equity (271,277) (270,333) (269,712)
12,644,140 11,804,178 9,762,034
Non-controlling interest 215,497 621,068 600,620
Total equity 12,859,637 12,425,246 10,362,654
Total liabilities and equity 32,318,499 32,114,512 31,781,884
(in millions of Korean Won) December 31, 2010 December 31, 2009 January 1, 2009
Assets
Current assets
Cash and cash equivalents 1,944,162 2,423,787 2,560,035
Financial deposits 85,000 223,000 50,000
Trade receivables 7,001,962 7,637,131 7,354,042
Loans and other receivables 525,046 714,636 867,812
Other financial assets 1,814 902 12,705
Inventories 5,872,420 4,899,313 5,263,826
Other current assets 1,079,099 1,011,304 1,210,514
Assets classified as held for sale 5,030 - -
16,514,533 16,910,073 17,318,934
Non-current assets
Financial deposits 105,479 162,373 190,240
Loans and other receivables 543,562 478,226 457,024
Other financial assets 105,601 102,473 27,141
Property, plant and equipment 6,500,484 7,708,933 7,775,316
Intangible assets 763,382 803,828 698,944
Deferred income tax assets 968,751 693,789 723,639
Investments in jointly controlled entities and associates 6,008,145 4,404,163 4,044,204
Investment property 7,295 12,979 13,111
Other non-current assets 801,267 837,675 533,331
15,803,966 15,204,439 14,462,950
Total assets 32,318,499 32,114,512 31,781,884
74 75