LG 2010 Annual Report Download - page 40
Download and view the complete annual report
Please find page 40 of the 2010 LG annual report below. You can navigate through the pages in the report by either clicking on the pages listed below, or by using the keyword search tool below to find specific information within the annual report.-
 1
1 -
2
-
3
-
4
-
5
-
6
-
7
-
8
-
9
-
10
-
11
-
12
-
13
-
14
-
15
-
16
-
17
-
18
-
19
-
20
-
21
-
22
-
23
-
24
-
25
-
26
-
27
-
28
-
29
-
 30
30 -
 31
31 -
 32
32 -
 33
33 -
 34
34 -
 35
35 -
 36
36 -
 37
37 -
 38
38 -
 39
39 -
 40
40 -
 41
41 -
 42
42
 |
 |

LG ELECTRONICS
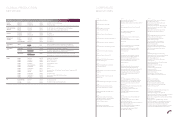
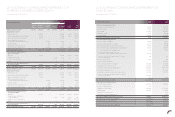
CONSOLIDATED INCOME STATEMENTS
Years ended December 31, 2010 and 2009
(in millions of Korean Won, except per share amounts) 2010 2009
Continuing operations
Net sales 55,753,804 55,491,157
Cost of sales 43,723,913 41,340,613
Gross profit 12,029,891 14,150,544
Selling and marketing expenses 7,270,523 6,740,274
Administrative expenses 1,402,217 1,297,264
Research and development expenses 1,500,759 1,269,828
Service costs 1,768,262 1,883,013
Other operating income 2,009,992 2,417,367
Other operating expenses 1,921,653 2,696,829
Operating income 176,469 2,680,703
Financial income 819,747 1,291,031
Financial expenses 1,039,012 1,542,430
Income from jointly controlled entities and associates 477,322 435,378
Profit before income tax 434,526 2,864,682
Income tax expense 141 588,680
Profit from continuing operations 434,385 2,276,002
Discontinued operations
Profit from discontinued operations 847,734 74,126
Profit for the year 1,282,119 2,350,128
Profit for the year attributable to:
Equity holders of the Parent Company 1,226,962 2,287,485
Profit for the year from continuing operations 393,713 2,240,182
Profit for the year from discontinued operations 833,249 47,303
Non-controlling interest 55,157 62,643
Profit for the year from continuing operations 40,672 35,820
Profit for the year from discontinued operations 14,485 26,823
Earnings per share attributable to the equity holders of
the Parent Company during the year (in won)
Earnings per share for profit attributable
to the ordinary equity holders of the company 7,612 14,197
Earnings per share for profit from continuing operations 2,443 13,903
Earnings per share for profit from discontinued operations 5,169 294
Earnings per share for profit attributable
to the preferred equity holders of the company 7,662 14,247
Earnings per share for profit from continuing operations 2,459 13,952
Earnings per share for profit from discontinued operations 5,203 295
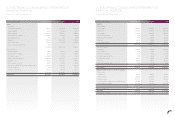
LG ELECTRONICS CONSOLIDATED STATEMENTS OF
COMPREHENSIVE INCOME
Years ended December 31, 2010 and 2009
(in millions of Korean Won) 2010 2009
Profit for the year
1,282,119 2,350,128
Other comprehensive expense:
Currency translation differences (32,311) (172,498)
Available-for-sale financial assets (1,262) 7,454
Cash flow hedges (38) 382
Actuarial loss on defined benefit liability (46,732) (15,858)
Share of actuarial loss of associates (3,692) (11,077)
Other comprehensive expense from jointly controlled entities
and associates (20,200) (22,452)
Other comprehensive expense for the year, net of tax (104,235) (214,049)
Total comprehensive income for the year 1,177,884 2,136,079
Comprehensive income for the year attributable to:
Equity holders of the Parent Company 1,123,631 2,099,997
Non-controlling interest 54,253 36,082
Total comprehensive income for the year 1,177,884 2,136,079
76 77