LG 2009 Annual Report Download - page 50
Download and view the complete annual report
Please find page 50 of the 2009 LG annual report below. You can navigate through the pages in the report by either clicking on the pages listed below, or by using the keyword search tool below to find specific information within the annual report.-
 1
1 -
2
-
3
-
4
-
5
-
6
-
7
-
8
-
9
-
10
-
11
-
12
-
13
-
14
-
15
-
16
-
17
-
18
-
19
-
20
-
21
-
22
-
23
-
24
-
25
-
26
-
27
-
28
-
29
-
30
-
31
-
32
-
33
-
34
-
35
-
36
-
37
-
38
-
39
-
 40
40 -
 41
41 -
 42
42 -
 43
43 -
 44
44 -
 45
45 -
 46
46 -
 47
47 -
 48
48 -
 49
49 -
 50
50 -
 51
51 -
 52
52 -
 53
53 -
 54
54
 |
 |

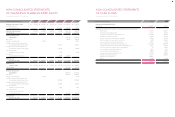
(in millions of Korean won) 2009 2008
Cash flows from operating activities
Net income \ 2,052,835 \ 482,786
Adjustments to reconcile net income to net cash provided by operating activities
Depreciation 531,954 588,793
Amortization of intangible assets 137,716 124,106
Loss (gain) on foreign currency translation, net (115,854) 393,684
Provisions for severance benefits 153,688 166,715
Loss from transfer of trade accounts receivable 70,466 151,878
Gain from disposal of investment securities, net (405) (53,626)
Loss on impairment of investment securities 37,577 3,062
Gain on valuation of equity-method investments, net (1,247,687) (590,786)
Loss (gain) on disposal of property, plant and equipment, net 21,873 (7,048)
Loss on impairment of property, plant and equipment 92 90,292
Loss on disposal of intangible assets, net 16,470 1,637
Loss on settlement of derivatives, net 38,538 98,530
Loss (gain) on valuation of derivatives, net (12,510) 124,254
Provisions for product warranty 321,441 385,582
Provisions for contingencies 280,943 -
Others (7,224) 14,152
227,078 1,491,225
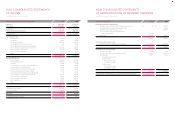
Balances as of January 1, 2008 \ 809,169 \ 2,219,993 \ (44,893) \ 703,467 \ 3,522,966 \ 7,210,702
Cumulative effect of
accounting change - 339,612 - (604,499) 290,123 25,236
Adjusted retained earnings 809,169 2,559,605 (44,893) 98,968 3,813,089 7,235,938
Cash dividends - - - - (137,765) (137,765)
Retained earnings after
appropriation - - - - 3,675,324 7,098,173
Net income - - - - 482,786 482,786
Change in capital surplus - 92,306 - - - 92,306
Change in equity method investees with
accumulated comprehensive income - - - 603,106 - 603,106
Change in equity method investees with
accumulated comprehensive expense - - - 130,998 - 130,998
Loss on valuation of
available-for-sale securities - - - (564) - (564)
Transfer to
other comprehensive income - - - 40,887 (40,887) -
Balances as of
December 31, 2008 \
809,169 \
2,651,911 \ (44,893) \ 873,395 \ 4,117,223 \ 8,406,805
Balances as of
January 1, 2009 \ 809,169 \ 2,651,911 \ (44,893) \ 873,395 \ 4,117,223 \ 8,406,805
Cash dividends - - - - (57,232) (57,232)
Retained earnings after
appropriation - - - - 4,059,991 8,349,573
Net income - - - - 2,052,835 2,052,835
Change in capital surplus - 16,733 - - - 16,733
Change in equity method investees with
accumulated comprehensive income - - - (178,298) - (178,298)
Change in equity method investees with
accumulated comprehensive expense - - - (32,875) - (32,875)
Loss on valuation of
available-for-sale securities - - - (691) - (691)
Loss on valuation of
equity-method investments
exceeding book value - - - - (47,484) (47,484)
Balances as of
December 31, 2009 \ 809,169 \
2,668,644 \ (44,893) \ 661,531 \ 6,065,342 \ 10,159,793
NON-CONSOLIDATED STATEMENTS
OF CHANGES IN SHAREHOLDERS' EQUITY
Years Ended December 31, 2009 and 2008
NON-CONSOLIDATED STATEMENTS
OF CASH FLOWS
Years Ended December 31, 2009 and 2008
(in millions of Korean won) Capital
stock Capital
surplus Capital
adjustments Retained
earnings
Accumulated
other comprehensive
income (expense) Total
87
86