Konica Minolta 2002 Annual Report Download - page 33
Download and view the complete annual report
Please find page 33 of the 2002 Konica Minolta annual report below. You can navigate through the pages in the report by either clicking on the pages listed below, or by using the keyword search tool below to find specific information within the annual report.-
 1
1 -
2
-
3
-
4
-
5
-
6
-
7
-
8
-
9
-
10
-
11
-
12
-
13
-
14
-
15
-
16
-
17
-
18
-
19
-
20
-
21
-
22
-
 23
23 -
 24
24 -
 25
25 -
 26
26 -
 27
27 -
 28
28 -
 29
29 -
 30
30 -
 31
31 -
 32
32 -
 33
33 -
 34
34 -
 35
35 -
 36
36 -
 37
37 -
 38
38 -
 39
39 -
 40
40
 |
 |

31 Konica 2002
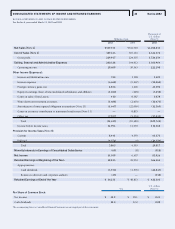
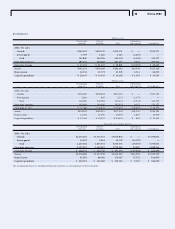
BY GEOGRAPHIC REGION
Millions of yen
North Asia Eliminations
Japan America Europe and Other Total and Corporate Consolidation
2002: Net sales
Outside ¥317,306 ¥126,361 ¥73,009 ¥22,894 ¥539,571 ¥ — ¥539,571
Intersegment 112,985 6,945 620 31,489 152,041 (152,041) —
Total 430,291 133,307 73,629 54,384 691,613 (152,041) 539,571
Operating expenses 397,599 129,796 71,686 53,104 652,186 (142,224) 509,961
Operating income ¥ 32,691 ¥ 3,511 ¥ 1,943 ¥ 1,280 ¥ 39,427 ¥ (9,817) ¥ 29,609
Assets ¥343,399 ¥ 98,286 ¥43,771 ¥18,412 ¥503,869 ¥ 23,491 ¥527,360
Millions of yen
North Asia Eliminations
Japan America Europe and Other Total and Corporate Consolidation
2001: Net sales
Outside ¥336,294 ¥120,016 ¥66,549 ¥20,858 ¥543,719 ¥ — ¥543,719
Intersegment 100,679 7,725 642 25,464 134,511 (134,511) —
Total 436,974 127,741 67,191 46,323 678,230 (134,511) 543,719
Operating expenses 400,687 125,587 68,062 45,581 639,919 (126,743) 513,175
Operating income ¥ 36,286 ¥ 2,154 ¥ (871) ¥ 741 ¥ 38,311 ¥ (7,767) ¥ 30,543
Assets ¥345,592 ¥ 93,245 ¥43,079 ¥15,754 ¥497,672 ¥ 20,508 ¥518,181
Thousands of U.S. dollars (Note 3)
North Asia Eliminations
Japan America Europe and Other Total and Corporate Consolidation
2002: Net sales
Outside $2,382,177 $ 948,656 $548,116 $171,877 $4,050,833 $ — $4,050,833
Intersegment 848,236 52,140 4,655 236,404 1,141,449 (1,141,449) —
Total 3,230,413 1,000,803 552,770 408,288 5,192,290 (1,141,449) 4,050,833
Operating expenses 2,984,977 974,444 538,183 398,679 4,896,291 (1,067,748) 3,828,536
Operating income $ 245,428 $ 26,359 $ 14,587 $ 9,610 $ 295,998 $ (73,701) $ 222,290
Assets $2,578,071 $ 737,883 $328,611 $138,228 $3,782,800 $ 176,359 $3,959,159
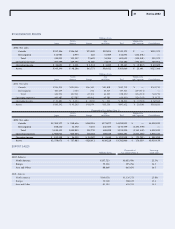
EXPORT SALES
Thousands of Percentage
Millions of yen U.S. dollars (Note 3) of net sales
2002: Sales to
North America ¥137,723 $1,033,956 25.5%
Europe 79,352 595,736 14.7
Asia and Other 88,668 665,676 16.5
2001: Sales to
North America ¥140,078 $1,130,573 25.8%
Europe 72,968 588,927 13.4
Asia and Other 81,199 655,359 14.9
コニカAR財務9.6H最新 02.9.25 10:03 ページ 19