Konica Minolta 2002 Annual Report Download - page 15
Download and view the complete annual report
Please find page 15 of the 2002 Konica Minolta annual report below. You can navigate through the pages in the report by either clicking on the pages listed below, or by using the keyword search tool below to find specific information within the annual report.-
 1
1 -
2
-
3
-
4
-
 5
5 -
 6
6 -
 7
7 -
 8
8 -
 9
9 -
 10
10 -
 11
11 -
 12
12 -
 13
13 -
 14
14 -
 15
15 -
 16
16 -
 17
17 -
 18
18 -
 19
19 -
 20
20 -
 21
21 -
 22
22 -
 23
23 -
 24
24 -
 25
25 -
26
-
27
-
28
-
29
-
30
-
31
-
32
-
33
-
34
-
35
-
36
-
37
-
38
-
39
-
40
 |
 |

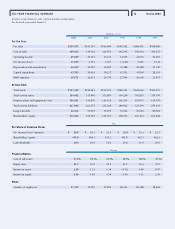
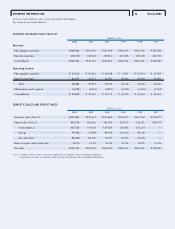
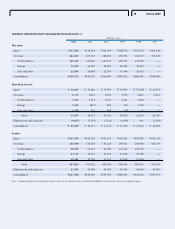
13 Konica 2002SIX-YEAR FINANCIAL SUMMARY
Millions of yen
2002 2001 2000 1999 1998 1997
For the Year:
Net sales ¥539,571 ¥543,719 ¥560,900 ¥584,342 ¥584,401 ¥578,080
Cost of sales 309,633 319,163 323,710 342,543 342,452 345,237
Operating income 29,609 30,543 33,131 14,575 23,062 23,604
Net income (loss) 11,059 6,457 7,627 (3,166) 5,501 4,541
Depreciation and amortization 26,219 25,940 30,687 32,488 28,488 27,130
Capital expenditure 45,593 30,424 30,237 42,702 47,850 28,261
R&D expenses 29,171 26,672 25,730 27,944 26,666 23,957
At Year-End:
Total assets ¥527,360 ¥518,181 ¥549,703 ¥589,201 ¥629,062 ¥592,997
Total current assets 309,602 317,890 335,899 349,240 392,855 370,399
Property, plant and equipment—net 156,061 141,870 141,114 161,534 159,873 145,970
Total current liabilities 267,805 262,273 272,568 280,922 324,194 279,241
Long-term debt 46,472 57,099 77,657 94,344 76,010 87,018
Shareholders’ equity 171,226 160,259 162,793 158,742 167,144 165,268
Yen
Per Share of Common Stock:
Net income (loss)—primary ¥30.9 ¥ 18.1 ¥ 21.3 ¥ (8.9) ¥ 15.4 ¥ 12.7
Shareholders’ equity 479.0 448.1 455.2 443.8 467.3 462.1
Cash dividends 10.0 10.0 10.0 10.0 10.0 10.0
Percent
Financial Ratios:
Cost of sales ratio 57.4% 58.7% 57.7% 58.6% 58.6% 59.7%
Equity ratio 32.5 30.9 29.6 26.9 26.6 27.9
Return on assets 2.10 1.21 1.34 (0.52) 0.90 0.79
Return on equity 6.46 4.00 4.74 (1.94) 3.31 2.76
Other:
Number of employees 17,319 17,595 17,839 18,953 18,388 18,664
KONICA CORPORATION AND CONSOLIDATED SUBSIDIARIES
For the fiscal years ended March 31
コニカAR財務9.6H最新 02.9.25 10:03 ページ 1