Konica Minolta 2002 Annual Report Download - page 26
Download and view the complete annual report
Please find page 26 of the 2002 Konica Minolta annual report below. You can navigate through the pages in the report by either clicking on the pages listed below, or by using the keyword search tool below to find specific information within the annual report.-
 1
1 -
2
-
3
-
4
-
5
-
6
-
7
-
8
-
9
-
10
-
11
-
12
-
13
-
14
-
15
-
 16
16 -
 17
17 -
 18
18 -
 19
19 -
 20
20 -
 21
21 -
 22
22 -
 23
23 -
 24
24 -
 25
25 -
 26
26 -
 27
27 -
 28
28 -
 29
29 -
 30
30 -
 31
31 -
 32
32 -
 33
33 -
 34
34 -
 35
35 -
 36
36 -
37
-
38
-
39
-
40
 |
 |

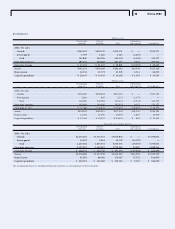
24 Konica 2002CONSOLIDATED STATEMENTS OF CASH FLOWS
KONICA CORPORATION AND CONSOLIDATED SUBSIDIARIES
For the fiscal years ended March 31, 2002 and 2001
Thousands of
U.S. dollars
Millions of yen (Note 3)
2002 2001 2002
Cash Flows from Operating Activities:
Income before income taxes ¥14,994 ¥ 11,059 $112,568
Depreciation and amortization 26,219 25,940 196,839
(Decrease) increase in allowance for doubtful receivables (2,055) 3,722 (15,428)
Interest and dividend income (720) (1,198) (5,405)
Interest expenses 6,668 9,267 50,060
Loss (gain) on sales or disposals of fixed assets, net 4,088 (6,606) 30,691
Write-down on investment securities 1,688 2,603 12,673
Amortization of unrecognized net obligation at transition 1,647 13,223 12,365
Loss on liquidation of affiliated company 2,451 360 18,401
Decrease in notes and accounts receivable 9,164 3,067 68,799
Decrease in inventories 4,202 5,151 31,547
Decrease in notes and accounts payable (13,349) (7,560) (100,218)
Decrease in accrued consumption tax payable (1,405) (740) (10,548)
Other 5,609 5,383 42,110
Subtotal 59,205 63,673 444,482
Interest and dividend income received 697 973 5,233
Interest expenses paid (6,773) (9,244) (50,848)
Income taxes paid (5,003) (4,479) (37,560)
Net cash provided by operating activities 48,125 50,923 361,299
Cash Flows from Investing Activities:
Proceeds from the sale of marketable securities —120 —
Payment for acquisition of fixed assets (41,616) (23,050) (312,432)
Proceeds from the sale of fixed assets 5,483 12,112 41,164
Payment for acquisition of investment securities (216) (573) (1,622)
Proceeds from the sale of investment securities 697 6,768 5,233
Other (3,845) (3,497) (28,866)
Net cash used in investing activities (39,496) (8,119) (296,517)
Cash Flows from Financing Activities:
Increase (decrease) in short-term debt 22,986 (23,200) 172,568
Proceeds from long-term debt 8,223 25,681 61,734
Redemption of long-term debt (33,512) (41,551) (251,592)
Proceeds from the issuance of bonds 2,000 —15,015
Redemption of bonds (15,150) —(113,739)
Payments for repurchase of treasury stocks (19) (1) (143)
Dividends paid (3,576) (3,576) (26,847)
Net cash used in financing activities (19,049) (42,648) (143,011)
Translation differences on cash and cash equivalents 904 966 6,787
(Decrease) increase in cash and cash equivalents (9,515) 1,121 (71,434)
Cash and cash equivalents at the beginning of the year 56,573 55,022 424,722
Increase in cash and cash equivalents by new consolidation 602 429 4,520
Cash and cash equivalents at fiscal year-end ¥47,659 ¥56,573 $357,800
The accompanying Notes to Consolidated Financial Statements are an integral part of these statements.
コニカAR財務9.6H最新 02.9.25 10:03 ページ 12