Konica Minolta 2002 Annual Report Download - page 19
Download and view the complete annual report
Please find page 19 of the 2002 Konica Minolta annual report below. You can navigate through the pages in the report by either clicking on the pages listed below, or by using the keyword search tool below to find specific information within the annual report.-
 1
1 -
2
-
3
-
4
-
5
-
6
-
7
-
8
-
 9
9 -
 10
10 -
 11
11 -
 12
12 -
 13
13 -
 14
14 -
 15
15 -
 16
16 -
 17
17 -
 18
18 -
 19
19 -
 20
20 -
 21
21 -
 22
22 -
 23
23 -
 24
24 -
 25
25 -
 26
26 -
 27
27 -
 28
28 -
 29
29 -
30
-
31
-
32
-
33
-
34
-
35
-
36
-
37
-
38
-
39
-
40
 |
 |

17 Konica 2002
were held at the same level as in the previous fiscal year,
the weakening of the yen had the effect of raising expenses
¥6.3 billion.
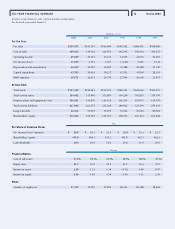
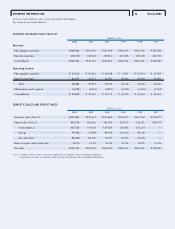
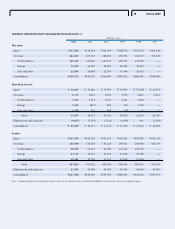
SALES RESULTS BY SEGMENT
Sales in our photographic materials segment declined 1.7%
compared with the previous year to ¥301.8 billion, and
operating income decreased 10% to ¥17.1 billion. Despite
higher sales in growth regions, mainly in Asia, owing to the
allocation of management resources to these regions, sales
and operating income for the Consumer Imaging Company
declined due to falling sales prices and lower demand in
such mature markets as Japan and the United States. The
Medical & Graphic Company recorded steady growth in
sales in its medical imaging business, which is experiencing
rising demand for dry film and X-ray imaging systems for
dry film.The graphic imaging business posted higher over-
seas sales, mainly in Asia. However, domestic sales in
graphic imaging declined. As a result, the Medical &
Graphic Company registered an approximately ¥2.0 billion
decline in sales but achieved a ¥1.5 billion rise in operating
income by implementing cost-reduction measures and
reducing sales and administrative expenses. The EM & ID
Business Group, which handles TAC film used for polarizing
filters in LCDs, posted declines in sales and operating
income due to the collapse of the IT market. Sales in the
Inkjet Business Group increased but the group posted an
operating loss.
Sales in our business machines segment edged up 0.4%
from the previous fiscal year to ¥240.4 billion, and operating
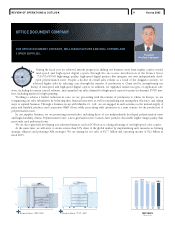
income advanced 7.5% to ¥21.7 billion. The Office
Document Company, which accounts for a relatively large
proportion of sales in the business machines segment,
recorded growth in both sales and operating income, thanks
to a steady expansion in sales of its medium- and high-speed
digital copiers as well as reductions in costs by shifting pro-
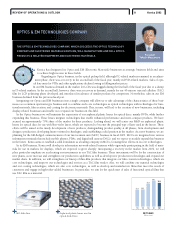
duction to China. The Optics & EM Technologies Company
suffered declines in both sales and operating income due to
the bursting of the IT bubble.
ANALYSIS OF PROFIT AND LOSS
As detailed above, despite the positive effects of the weak-
ening of the yen, net sales declined because of the collapse
of the IT bubble. Conversely, SG&A expenses increased
owing to the effects of a weaker yen. As a result, operating
income declined 3.1% compared with the previous year to
¥29.6 billion, and the operating margin decreased 0.1 per-
centage point to 5.5%. In other income and expenses, the
Company recorded a ¥4.9 billion improvement in operating
expenses to ¥14.6 billion. Non-operating income items
included ¥0.7 billion in interest and dividend income, com-
pared with ¥1.2 billion in the previous year, and ¥2.9 billion
in foreign currency gains, net, up from ¥1.6 billion. The
decline in interest and dividend income was the result of
selling off marketable securities.
Non-operating expense items included ¥6.7 billion in
interest expenses, compared with ¥9.3 billion the previous
year. This decline was due to our reduction of interest-
bearing debt and lower interest rates in the United States.
As a result of the foregoing, income before income taxes
jumped 35.6% from the previous fiscal year to ¥15.0 billion.
Net income soared 71.3% to ¥11.1 billion. Net income per
コニカAR財務9.6H最新 02.9.25 10:03 ページ 5