Konica Minolta 2002 Annual Report Download - page 3
Download and view the complete annual report
Please find page 3 of the 2002 Konica Minolta annual report below. You can navigate through the pages in the report by either clicking on the pages listed below, or by using the keyword search tool below to find specific information within the annual report.-
 1
1 -
 2
2 -
 3
3 -
 4
4 -
 5
5 -
 6
6 -
 7
7 -
 8
8 -
 9
9 -
 10
10 -
 11
11 -
 12
12 -
 13
13 -
 14
14 -
15
-
16
-
17
-
18
-
19
-
20
-
21
-
22
-
23
-
24
-
25
-
26
-
27
-
28
-
29
-
30
-
31
-
32
-
33
-
34
-
35
-
36
-
37
-
38
-
39
-
40
 |
 |

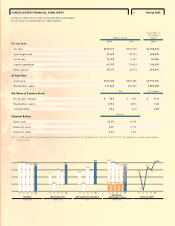
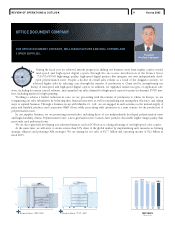
CONSOLIDATED FINANCIAL HIGHLIGHTS 1Konica 2002
Thousands of
U.S. dollars
Millions of yen (Note)
2002 2001 2002
For the Year:
Net sales ¥539,571 ¥543,719 $4,050,833
Operating income 29,609 30,543 222,290
Net income 11,059 6,457 83,026
Capital expenditure 45,593 30,424 342,290
R&D expenses 29,171 26,672 219,001
At Year-End:
Total assets ¥527,360 ¥518,181 $3,959,159
Shareholders’ equity 171,226 160,259 1,285,480
Yen U.S. dollars
Per Share of Common Stock:
Net income—primary ¥ 30.9 ¥ 18.1 $ 0.23
Shareholders’ equity 479.0 448.1 3.60
Cash dividends 10.0 10.0 0.08
Percent
Financial Ratios:
Equity ratio 32.5% 30.9%
Return on assets 2.10 1.21
Return on equity 6.46 4.00
Note: U.S. dollar amounts above and elsewhere in this report are translated from yen, for convenience only, at the rate of ¥133.20=US$1, the approximate exchange rate prevailing at
March 31, 2002.
(Billions of yen)
Net Sales
(Billions of yen)
Net Income (Loss)
’98
5.5
’99
–3.2
’00
7.6
’01
6.5
’02
11.1
(Yen)
Net Income (Loss) per Share
’98
15.4
’99
–8.9
’00
21.3
’01
18.1
’02
30.9
(Billions of yen)
Total Assets /
Shareholders’ Equity
’98
629.1
’99
589.2
’00
549.7
’01
518.2
’02
527.4
(%)
Return on Equity
’98
3.31
’99
–1.94
’00
4.74
’01
4.0
’02
6.46
’98
584.4
’99
584.3
’00
560.9
’01
543.7
’02
539.6
167.1 158.7 162.8 160.3 171.2
KONICA CORPORATION AND CONSOLIDATED SUBSIDIARIES
For the fiscal years ended March 31, 2002 and 2001