Konica Minolta 2002 Annual Report Download - page 16
Download and view the complete annual report
Please find page 16 of the 2002 Konica Minolta annual report below. You can navigate through the pages in the report by either clicking on the pages listed below, or by using the keyword search tool below to find specific information within the annual report.-
 1
1 -
2
-
3
-
4
-
5
-
 6
6 -
 7
7 -
 8
8 -
 9
9 -
 10
10 -
 11
11 -
 12
12 -
 13
13 -
 14
14 -
 15
15 -
 16
16 -
 17
17 -
 18
18 -
 19
19 -
 20
20 -
 21
21 -
 22
22 -
 23
23 -
 24
24 -
 25
25 -
 26
26 -
27
-
28
-
29
-
30
-
31
-
32
-
33
-
34
-
35
-
36
-
37
-
38
-
39
-
40
 |
 |

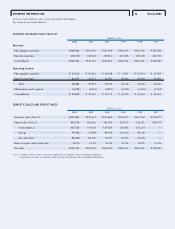
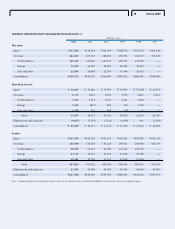
14 Konica 2002SEGMENT INFORMATION
KONICA CORPORATION AND CONSOLIDATED SUBSIDIARIES
For the fiscal years ended March 31
SEGMENT INFORMATION BY PRODUCT
Millions of yen
2002 2001 2000 1999 1998 1997
Net sales:
Photographic materials ¥300,401 ¥305,200 ¥321,084 ¥336,643 ¥354,101 ¥357,298
Business machines 239,170 238,518 239,816 247,698 230,300 220,782
Consolidated ¥539,571 ¥543,719 ¥560,900 ¥584,342 ¥584,401 ¥578,080
Operating income:
Photographic materials ¥ 17,123 ¥ 19,022 ¥ 18,158 ¥ 3,041 ¥ 14,034 ¥ 15,583
Business machines 21,677 20,174 24,786 18,086 18,490 10,782
Total 38,801 39,197 42,945 21,128 32,525 26,366
Eliminations and corporate (9,191) (8,654) (9,813) (6,553) (9,462) (2,761)
Consolidated ¥ 29,609 ¥ 30,543 ¥ 33,131 ¥ 14,575 ¥ 23,062 ¥ 23,604
DOMESTIC SALES AND EXPORT SALES
Millions of yen
2002 2001 2000 1999 1998 1997
Domestic sales (Note 1) ¥233,827 ¥249,473 ¥256,824 ¥254,193 ¥263,730 ¥271,007
Export sales (Note 2): 305,744 294,246 304,076 330,149 320,671 307,073
North America 137,723 140,078 139,380 156,583 145,153 —
Europe 79,352 72,968 85,694 103,010 98,300 —
Asia and other 88,668 81,199 79,001 70,555 77,218 —
Ratio of export sales to net sales 56.7% 54.1% 54.2% 56.5% 54.9% 53.1%
Net sales ¥539,571 ¥543,719 ¥560,900 ¥584,342 ¥584,401 ¥578,080
Notes: 1. Domestic sales are sales to customers in Japan by the Company and its consolidated subsidiaries.
2. Export sales are sales to customers outside Japan by the Company and its consolidated subsidiaries.
コニカAR財務9.6H最新 02.9.25 10:03 ページ 2