Konica Minolta 1999 Annual Report Download - page 5
Download and view the complete annual report
Please find page 5 of the 1999 Konica Minolta annual report below. You can navigate through the pages in the report by either clicking on the pages listed below, or by using the keyword search tool below to find specific information within the annual report.-
 1
1 -
 2
2 -
 3
3 -
 4
4 -
 5
5 -
 6
6 -
 7
7 -
 8
8 -
 9
9 -
 10
10 -
 11
11 -
 12
12 -
 13
13 -
 14
14 -
 15
15 -
 16
16 -
17
-
18
-
19
-
20
-
21
-
22
-
23
-
24
-
25
-
26
-
27
-
28
-
29
-
30
-
31
-
32
-
33
-
34
 |
 |

KONICA 1
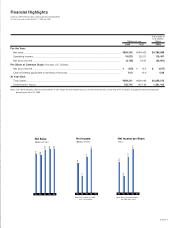
Financial Highlights
KONICA CORPORATION AND CONSOLIDATED SUBSIDIARIES
For the fiscal years ended March 31, 1999 and 1998
Thousands of
U.S. dollars
Millions of yen (Note)
1999 1998 1999
For the Year:
Net sales ............................................................................................................................................... ¥584,342 ¥584,402 $4,789,689
Operating income ................................................................................................................................. 14,575 25,211 119,467
Net (loss) income .................................................................................................................................. (3,166) 5,501 (25,951)
Per Share of Common Stock (Yen and U.S. Dollars):
Net (loss) income .................................................................................................................................. ¥ (8.9) ¥ 15.4 $ (0.07)
Cash dividends applicable to earnings of the year............................................................................... 10.0 10.0 0.08
At Year-End:
Total assets........................................................................................................................................... ¥589,201 ¥629,063 $4,829,516
Shareholders’ equity............................................................................................................................. 158,742 167,145 1,301,164
Note: U.S. dollar amounts above and elsewhere in this report are translated from yen, for convenience only, at the rate of ¥122=US$1, the approximate exchange rate
prevailing at June 28, 1999.
3.8
2.1
4.5
5.5
’95 ’96 ’97 ’98 ’99
Net Income
(Billions of Yen)
10.8
5.9
12.7
15.4
’95 ’96 ’97 ’98 ’99
Net Income per Share
(Yen)
518
505
578
584
584
’95 ’96 ’97 ’98 ’99
Net Sales
(Billions of Yen)
Note: Net Income for 1999
was –¥3.2 billion. Note: Net Income per Share
for 1999 was –¥8.9.