Konica Minolta 1999 Annual Report Download - page 23
Download and view the complete annual report
Please find page 23 of the 1999 Konica Minolta annual report below. You can navigate through the pages in the report by either clicking on the pages listed below, or by using the keyword search tool below to find specific information within the annual report.-
 1
1 -
2
-
3
-
4
-
5
-
6
-
7
-
8
-
9
-
10
-
11
-
12
-
 13
13 -
 14
14 -
 15
15 -
 16
16 -
 17
17 -
 18
18 -
 19
19 -
 20
20 -
 21
21 -
 22
22 -
 23
23 -
 24
24 -
 25
25 -
 26
26 -
 27
27 -
 28
28 -
 29
29 -
 30
30 -
 31
31 -
 32
32 -
 33
33 -
34
 |
 |

KONICA 19
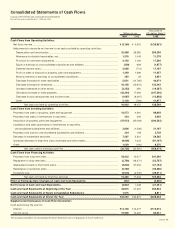
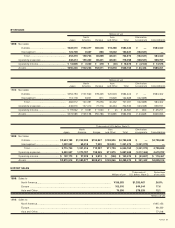
Consolidated Statements of Cash Flows
KONICA CORPORATION AND CONSOLIDATED SUBSIDIARIES
For the fiscal years ended March 31, 1999 and 1998
Thousands of
Millions of yen U.S. dollars (Note 2)
1999 1998 1999
Cash Flows from Operating Activities:
Net (loss) income .............................................................................................................................. ¥ (3,166) ¥ 5,501 $ (25,951)
Adjustments to reconcile net income to net cash provided by operating activities:
Depreciation and amortization...................................................................................................... 32,488 28,580 266,295
Allowance for doubtful receivables, net........................................................................................ 1,376 1,043 11,279
Provision for retirement allowances.............................................................................................. 2,143 1,162 17,566
Equity in earnings of unconsolidated subsidiaries and affiliates .................................................. (229) 609 (1,877)
Deferred income taxes.................................................................................................................. 2,098 (714) 17,197
Profit on sales or disposal of property, plant and equipment....................................................... 1,349 1,396 11,057
Minority interests in earnings of consolidated subsidiaries .......................................................... 360 26 2,951
Decrease (increase) in trade receivables ...................................................................................... 5,621 (14,765) 46,074
Decrease (increase) in inventories ................................................................................................ 16,158 (13,615) 132,442
(Increase) decrease in other assets .............................................................................................. (2,353) 381 (19,287)
(Decrease) increase in trade payables.......................................................................................... (42,364) 17,094 (347,246)
Decrease in accrued expenses and income taxes ....................................................................... (1,687) (6,467) (13,828)
Other ............................................................................................................................................. 5,109 (794) 41,877
Net cash provided by operating activities......................................................................... 16,903 19,437 138,549
Cash Flows from Investing Activities:
Proceeds from sales of property, plant and equipment ................................................................... 12,073 4,391 98,959
Proceeds from sales of investments in securities............................................................................. 324 400 2,656
Acquisition of property, plant and equipment................................................................................... (47,612) (45,009) (390,262)
Liquidation and sales (purchases) of investments in securities,
unconsolidated subsidiaries and affiliates ...................................................................................... 3,806 (1,506) 31,197
Proceeds from loans to unconsolidated subsidiaries and affiliates.................................................. 334 109 2,738
Decrease in marketable securities.................................................................................................... 7,267 5,301 59,565
(Increase) decrease in long-term loans receivable and other assets................................................ (9,906) 1,023 (81,197)
Other ................................................................................................................................................. 1,009 (100) 8,270
Net cash used in investing activities................................................................................. (32,705) (35,391) (268,074)
Cash Flows from Financing Activities:
Proceeds from long-term debt.......................................................................................................... 29,432 10,017 241,246
Repayment of long-term debt........................................................................................................... (2,780) (16,371) (22,787)
(Decrease) increase in short-term loans ........................................................................................... (3,802) 27,332 (31,164)
Redemption of preferred stock ......................................................................................................... (6,782) —(55,590)
Dividends paid .................................................................................................................................. (3,576) (3,576) (29,311)
Net cash provided by financing activities ......................................................................... 12,492 17,402 102,394
Effect of Exchange Rate Changes on Cash and Cash Equivalents ............................................... (527) —(4,320)
Net Increase in Cash and Cash Equivalents..................................................................................... (3,837) 1,448 (31,451)
Cash and Cash Equivalents at Beginning of the Year..................................................................... 42,815 41,367 350,943
Cash and Cash Equivalents of Newly Consolidated Subsidiaries.................................................. 1,075 —8,811
Cash and Cash Equivalents at End of the Year................................................................................ ¥40,053 ¥42,815 $328,303
Supplemental Disclosures of Cash Flow Information:
Cash paid during the year for:
Interest .............................................................................................................................................. ¥14,100 ¥10,477 $115,574
Income taxes..................................................................................................................................... 10,558 14,420 86,541
The accompanying Notes to Consolidated Financial Statements are an integral part of these statements.