Konica Minolta 1999 Annual Report Download - page 18
Download and view the complete annual report
Please find page 18 of the 1999 Konica Minolta annual report below. You can navigate through the pages in the report by either clicking on the pages listed below, or by using the keyword search tool below to find specific information within the annual report.-
 1
1 -
2
-
3
-
4
-
5
-
6
-
7
-
 8
8 -
 9
9 -
 10
10 -
 11
11 -
 12
12 -
 13
13 -
 14
14 -
 15
15 -
 16
16 -
 17
17 -
 18
18 -
 19
19 -
 20
20 -
 21
21 -
 22
22 -
 23
23 -
 24
24 -
 25
25 -
 26
26 -
 27
27 -
 28
28 -
29
-
30
-
31
-
32
-
33
-
34
 |
 |

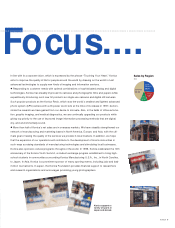
OPERATING ENVIRONMENT
In fiscal 1999, ended March 31, 1999, weak consumer spending
and private-sector capital investment prevented the Japanese
economy from moving any closer to recovery.
ROverseas, while demand for Konica’s mainstay products in the
United States and Europe was solid, the economic downturn in
Asia continued to have a serious effect on sales in certain prod-
uct segments.
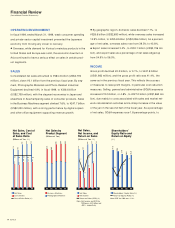
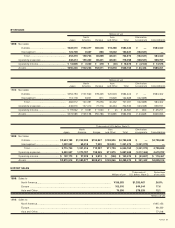
SALES
Consolidated net sales amounted to ¥584.3 billion (US$4,790
million), down ¥0.1 billion from the previous fiscal year. By seg-
ment, Photographic Materials and Photo-Related Industrial
Equipment declined 4.9% in fiscal 1999, to ¥336.6 billion
(US$2,759 million), with the stagnant economies in Japan and
elsewhere in Asia hampering sales of consumer products. Sales
in the Business Machines segment climbed 7.6%, to ¥247.7 billion
(US$2,030 million), with a strong performance by digital copiers
and other office equipment supporting revenue growth.
RBy geographic region, domestic sales declined 7.1%, to
¥328.6 billion (US$2,693 million), while overseas sales increased
10.9% billion, to ¥255.8 billion (US$2,096 million). As a percent-
age of net sales, overseas sales rose from 39.5% to 43.8%.
RExport sales increased 3.0%, to ¥330.1 billion (US$2,706 mil-
lion), and export sales as a percentage of net sales edged up
from 54.9% to 56.5%.
INCOME
Gross profit declined ¥0.2 billion, or 0.1%, to ¥241.8 billion
(US$1,982 million), and the gross profit ratio was 41.4%, the
same as in the previous fiscal year. This reflects the success
of measures to raise profit margins, in particular cost reduction
measures. Selling, general and administrative (SG&A) expenses
increased ¥10.5 billion, or 4.8%, to ¥227.2 billion (US$1,862 mil-
lion), due mainly to costs associated with sales and market net-
work rationalization activities and a sharp increase in the value
of the yen in the second half of the fiscal year. As a percentage
of net sales, SG&A expenses rose 1.8 percentage points, to
14 KONICA
’95 ’96 ’97 ’98 ’99
Net Sales, Cost of
Sales, and Cost
of Sales Ratio
(Billions of Yen, %)
Net Sales
Cost of Sales
Cost of Sales Ratio (%)
518
505
578
584
584
311
298
345
342
343
59
60 60 59 59
’95 ’96 ’97 ’98 ’99
Net Sales by
Product Segment
(Billions of Yen)
Business Machines
Photographic Materials
518
505
578
584
584
’95 ’96 ’97 ’98 ’99
Net Sales,
Net Income, and
Return on Sales
(Billions of Yen, %)
Net Sales
Net Income
Return on Sales (ROS) (%)
518
505
578
584
584
3.8
2.1
4.5
5.5
Note: Net Income and ROS for
1999 were –¥3.2 billion and
–0.5%, respectively.
0.4
0.7
0.8
0.9
31.0
29.8
27.9
26.6
26.9
’95 ’96 ’97 ’98 ’99
Shareholders’
Equity Ratio and
Return on Equity
(%)
Shareholders’ Equity Ratio (%)
Return on Equity (ROE) (%)
2.7
3.3
1.3
2.3
Note: ROE for 1999 was –1.9%.
Financial Review
(Consolidated Financial Statements)