Konica Minolta 1999 Annual Report Download - page 24
Download and view the complete annual report
Please find page 24 of the 1999 Konica Minolta annual report below. You can navigate through the pages in the report by either clicking on the pages listed below, or by using the keyword search tool below to find specific information within the annual report.-
 1
1 -
2
-
3
-
4
-
5
-
6
-
7
-
8
-
9
-
10
-
11
-
12
-
13
-
 14
14 -
 15
15 -
 16
16 -
 17
17 -
 18
18 -
 19
19 -
 20
20 -
 21
21 -
 22
22 -
 23
23 -
 24
24 -
 25
25 -
 26
26 -
 27
27 -
 28
28 -
 29
29 -
 30
30 -
 31
31 -
 32
32 -
 33
33 -
 34
34
 |
 |

20 KONICA
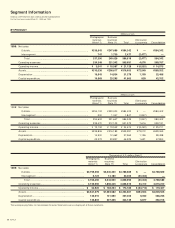
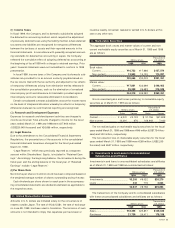
Segment Information
KONICA CORPORATION AND CONSOLIDATED SUBSIDIARIES
For the fiscal years ended March 31, 1999 and 1998
BY PRODUCT
Millions of yen
Photographic Business
materials machines Elimination
(Note 11) (Note 11) Total & corporate Consolidation
1999: Net sales
Outside...................................................................................... ¥336,643 ¥247,699 ¥584,342 ¥ — ¥584,342
Intersegment ............................................................................. 747 1,730 2,477 (2,477) —
Total ...................................................................................... 337,390 249,429 586,819 (2,477) 584,342
Operating expenses...................................................................... 334,349 231,342 565,691 4,076 569,767
Operating income.......................................................................... ¥ 3,041 ¥ 18,087 ¥ 21,128 ¥ (6,553) ¥ 14,575
Assets............................................................................................ ¥310,036 ¥206,617 ¥516,653 ¥72,549 ¥589,202
Depreciation.................................................................................. 16,545 14,834 31,379 1,109 32,488
Capital expenditure....................................................................... 16,568 25,295 41,863 839 42,702
Millions of yen
Photographic Business
materials machines Elimination
(Note 11) (Note 11) Total & corporate Consolidation
1998: Net sales
Outside...................................................................................... ¥354,102 ¥230,300 ¥584,402 ¥ — ¥584,402
Intersegment ............................................................................. 500 1,347 1,847 (1,847) —
Total ...................................................................................... 354,602 231,647 586,249 (1,847) 584,402
Operating expenses...................................................................... 339,470 212,105 551,575 7,616 559,191
Operating income.......................................................................... ¥ 15,132 ¥ 19,542 ¥ 34,674 ¥ (9,463) ¥ 25,211
Assets............................................................................................ ¥339,806 ¥216,185 ¥555,991 ¥73,072 ¥629,063
Depreciation.................................................................................. 14,900 12,462 27,362 1,126 28,488
Capital expenditure....................................................................... 25,372 20,857 46,229 1,621 47,850
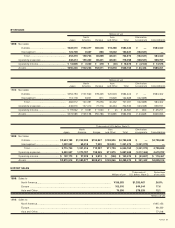
Thousands of U.S. dollars (Note 2)
Photographic Business
materials machines Elimination
(Note 11) (Note 11) Total & corporate Consolidation
1999: Net sales
Outside................................................................................ $2,759,369 $2,030,320 $4,789,689 $ — $4,789,689
Intersegment ....................................................................... 6,123 14,180 20,303 (20,303) —
Total ................................................................................ 2,765,492 2,044,500 4,809,992 (20,303) 4,789,689
Operating expenses ................................................................ 2,740,566 1,896,246 4,636,812 33,410 4,670,222
Operating income.................................................................... $ 24,926 $ 148,254 $ 173,180 $ (53,713) $ 119,467
Assets...................................................................................... $2,541,279 $1,693,582 $4,234,861 $594,664 $4,829,525
Depreciation ............................................................................ 135,615 121,590 257,205 9,090 266,295
Capital expenditure................................................................. 135,803 207,336 343,139 6,877 350,016
The accompanying Notes to Consolidated Financial Statements are an integral part of these statements.