Konica Minolta 1999 Annual Report Download - page 19
Download and view the complete annual report
Please find page 19 of the 1999 Konica Minolta annual report below. You can navigate through the pages in the report by either clicking on the pages listed below, or by using the keyword search tool below to find specific information within the annual report.-
 1
1 -
2
-
3
-
4
-
5
-
6
-
7
-
8
-
 9
9 -
 10
10 -
 11
11 -
 12
12 -
 13
13 -
 14
14 -
 15
15 -
 16
16 -
 17
17 -
 18
18 -
 19
19 -
 20
20 -
 21
21 -
 22
22 -
 23
23 -
 24
24 -
 25
25 -
 26
26 -
 27
27 -
 28
28 -
 29
29 -
30
-
31
-
32
-
33
-
34
 |
 |

KONICA 15
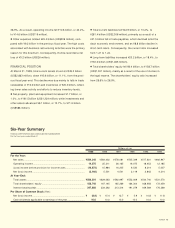
Six-Year Summary
KONICA CORPORATION AND CONSOLIDATED SUBSIDIARIES
For the fiscal years ended March 31
Millions of yen
1999 1998 1997 1996 1995 1994
For the Year:
Net sales.......................................................................................... ¥584,342 ¥584,402 ¥578,081 ¥505,349 ¥517,601 ¥492,947
Operating income............................................................................ 14,575 25,211 26,165 19,075 18,453 12,185
(Loss) income before provision for income taxes............................ (10,872) 15,984 16,205 9,530 8,214 5,007
Net (loss) income............................................................................. (3,166) 5,501 4,541 2,119 3,843 4,214
At Year-End:
Total assets ..................................................................................... ¥589,201 ¥629,063 ¥592,997 ¥552,009 ¥544,740 ¥531,570
Total shareholders’ equity ............................................................... 158,742 167,145 165,269 164,304 168,958 172,459
Interest-bearing debt....................................................................... 247,882 234,292 213,314 191,279 169,569 176,269
Per Share of Common Stock (Yen):
Net (loss) income............................................................................. ¥ (8.9) ¥ 15.4 ¥ 12.7 ¥ 5.9 ¥ 10.8 ¥ 11.8
Cash dividends applicable to earnings of the year ......................... 10.0 10.0 10.0 10.0 10.0 10.0
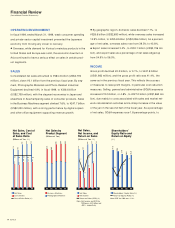
38.9%. As a result, operating income fell ¥10.6 billion, or 42.2%,
to ¥14.6 billion (US$119 million).
ROther expenses totaled ¥25.4 billion (US$209 million), com-
pared with ¥9.2 billion in the previous fiscal year. The high costs
associated with business restructuring activities were the primary
reason for this downturn. Consequently, Konica recorded a net
loss of ¥3.2 billion (US$26 million).
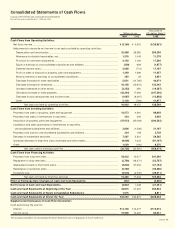
FINANCIAL POSITION
At March 31, 1999, total current assets stood at ¥349.2 billion
(US$2,863 million), down ¥43.6 billion, or 11.1%, from the previ-
ous fiscal year-end. This decline was due mainly to falls in trade
receivables of ¥10.0 billion and inventories of ¥20.3 billion, reflect-
ing lower sales activity and efforts to reduce inventory levels.
RNet property, plant and equipment increased ¥1.7 billion, or
1.0%, to ¥161.5 billion (US$1,324 million), while investments and
other assets advanced ¥8.1 billion, or 12.7%, to ¥71.5 billion
(US$586 million).
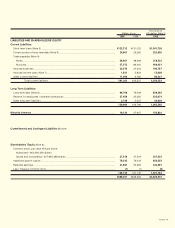
RTotal current liabilities fell ¥42.9 billion, or 13.2%, to
¥281.4 billion (US$2,306 million), primarily as a result of a
¥41.5 billion fall in trade payables, which declined amid the
slack economic environment, and an ¥8.8 billion decline in
short-term loans. Consequently, the current ratio increased
from 1.21 to 1.24.
RLong-term liabilities increased ¥20.2 billion, or 18.4%, to
¥130.0 billion (US$1,065 million).
RTotal shareholders’ equity fell ¥8.4 billion, to ¥158.7 billion
(US$1,301 million), mainly as a result of the use of monies in
the legal reserve. The shareholders’ equity ratio increased
from 26.6% to 26.9%.