JetBlue Airlines 2015 Annual Report Download - page 63
Download and view the complete annual report
Please find page 63 of the 2015 JetBlue Airlines annual report below. You can navigate through the pages in the report by either clicking on the pages listed below, or by using the keyword search tool below to find specific information within the annual report.-
 1
1 -
2
-
3
-
4
-
5
-
6
-
7
-
8
-
9
-
10
-
11
-
12
-
13
-
14
-
15
-
16
-
17
-
18
-
19
-
20
-
21
-
22
-
23
-
24
-
25
-
26
-
27
-
28
-
29
-
30
-
31
-
32
-
33
-
34
-
35
-
36
-
37
-
38
-
39
-
40
-
41
-
42
-
43
-
44
-
45
-
46
-
47
-
48
-
49
-
50
-
51
-
52
-
 53
53 -
 54
54 -
 55
55 -
 56
56 -
 57
57 -
 58
58 -
 59
59 -
 60
60 -
 61
61 -
 62
62 -
 63
63 -
 64
64 -
 65
65 -
 66
66 -
 67
67 -
 68
68 -
 69
69 -
 70
70 -
 71
71 -
 72
72 -
 73
73 -
74
-
75
-
76
-
77
-
78
-
79
-
80
-
81
-
82
-
83
-
84
-
85
-
86
-
87
 |
 |
JETBLUE AIRWAYS CORPORATION-2015Annual Report 59
PART II
ITEM 8Financial Statements and Supplementary Data
Interest rate swaps
The interest rate swap agreements we had outstanding as of December31,
2015 effectively swap floating rate debt for fixed rate debt, taking advantage
of lower borrowing rates in existence at the time of the hedge transaction
as compared to the date our original debt instruments were executed. As
of December 31, 2015, we had $16 million in notional debt outstanding
related to these swaps, which cover certain interest payments through
August 2016. The notional amount decreases over time to match scheduled
repayments of the related debt. Refer to Note 2 for information on the debt
outstanding related to these swap agreements.
All of our outstanding interest rate swap contracts qualify as cash flow hedges
in accordance with the Derivatives and Hedging topic of the Codification.
Since all of the critical terms of our swap agreements match the debt to
which they pertain, there was no ineffectiveness relating to these interest
rate swaps for the years ended December 31, 2015, 2014 or 2013, and all
related unrealized losses were deferred in accumulated other comprehensive
income. We recognized approximately $1 million, $1 million and $8 million
in additional interest expense as the related interest payments were made
during the years ended December 31, 2015, 2014 and 2013, respectively.
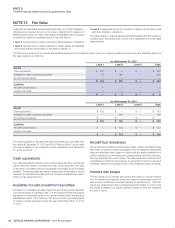
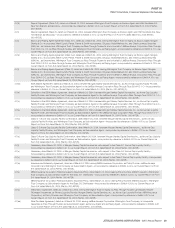
The table below reflects quantitative information related to our derivative instruments and where these amounts are recorded in our financial statements
(dollar amounts in millions).
As of December 31,
2015 2014
Fuel derivatives
Asset fair value recorded in prepaid expenses and other(1) $ — $ —
Liability fair value recorded in other accrued liabilities(1) 5 102
Longest remaining term (months) 12 12
Hedged volume (barrels, in thousands) 900 2,808
Estimated amount of existing losses expected to be reclassified into earnings in the next 12 months 4 102
Interest rate derivatives
Liability fair value recorded in other long term liabilities(2) — 1
Estimated amount of existing losses expected to be reclassified into earnings in the next 12 months — 1
2015 2014 2013
Fuel derivatives
Hedge effectiveness losses recognized in aircraft fuel expense $ 126 $ 30 $ 10
(Losses) gains on derivatives not qualifying for hedge accounting recognized in other expense (1) 2 —
Hedge losses on derivatives recognized in comprehensive income 29 134 6
Percentage of actual consumption economically hedged 17% 20% 21%
Interest rate derivatives
Hedge losses on derivatives recognized in interest expense 1 1 8
Hedge gains on derivatives recognized in comprehensive income — — 1
(1) Gross asset or liability of each contract prior to consideration of offsetting positions with each counterparty and prior to impact of collateral paid.
(2) Gross liability prior to impact of collateral posted.
Any outstanding derivative instrument exposes us to credit loss in connection
with our fuel contracts in the event of nonperformance by the counterparties
to the agreements, but we do not expect any of our counterparties will
fail to meet their obligations. The amount of such credit exposure is
generally the fair value of our outstanding contracts for which we are in a
liability position. To manage credit risks we select counterparties based on
credit assessments, limit our overall exposure to any single counterparty
and monitor the market position with each counterparty. Some of our
agreements require cash deposits from either counterparty if market risk
exposure exceeds a specified threshold amount.
We have master netting arrangements with our counterparties allowing
us the right of offset to mitigate credit risk in derivative transactions. The
financial derivative instrument agreements we have with our counterparties
may require us to fund all, or a portion of, outstanding loss positions
related to these contracts prior to their scheduled maturities. The amount
of collateral posted, if any, is periodically adjusted based on the fair value
of the hedge contracts. Our policy is to offset the liabilities represented
by these contracts with any cash collateral paid to the counterparties.
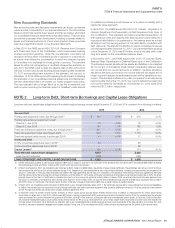
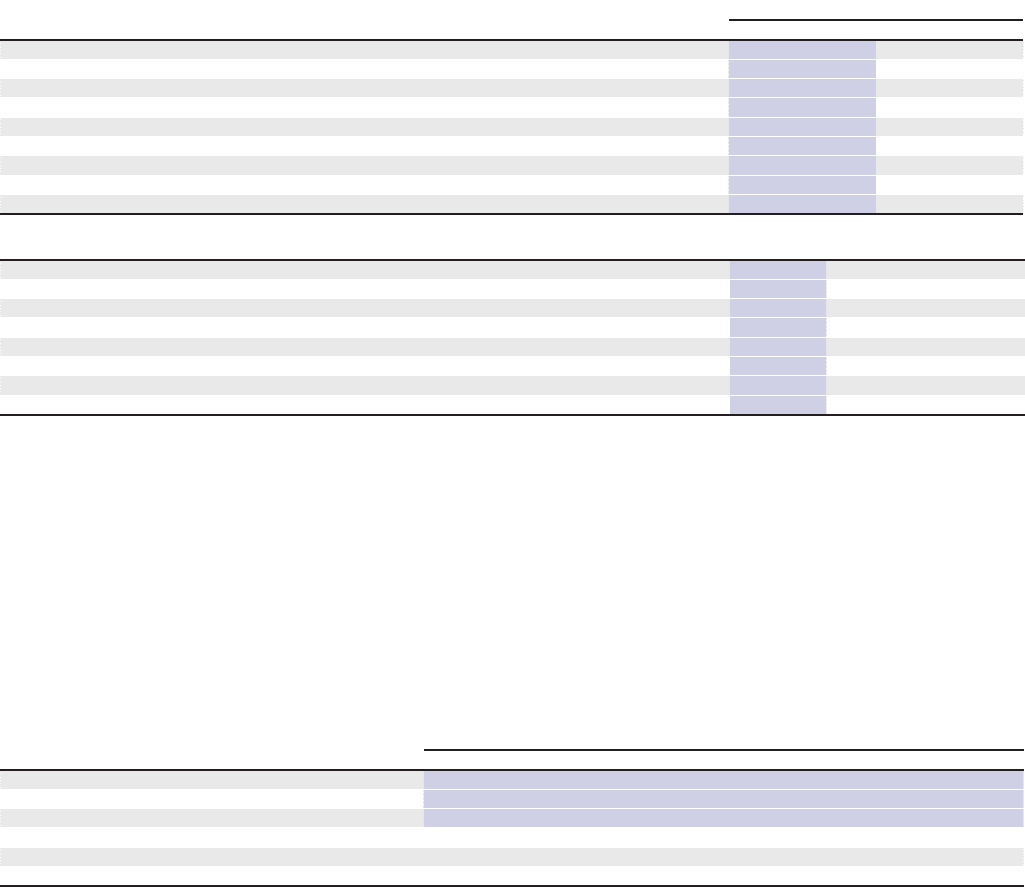
The impact of offsetting derivative instruments is depicted below (in millions):
Gross Amount of
Recognized
Gross Amount of
Cash Collateral
Net Amount Presented
in Balance Sheet
Assets Liabilities Offset Assets Liabilities
As of December 31, 2015
Fuel derivatives $ — $ 5 $ — $ — $ 5
Interest rate derivatives — — — — —
As of December 31, 2014
Fuel derivatives $ — $ 102 $ 51 $ — $ 51
Interest rate derivatives — 1 1 — —