JetBlue Airlines 2015 Annual Report Download - page 34
Download and view the complete annual report
Please find page 34 of the 2015 JetBlue Airlines annual report below. You can navigate through the pages in the report by either clicking on the pages listed below, or by using the keyword search tool below to find specific information within the annual report.-
 1
1 -
2
-
3
-
4
-
5
-
6
-
7
-
8
-
9
-
10
-
11
-
12
-
13
-
14
-
15
-
16
-
17
-
18
-
19
-
20
-
21
-
22
-
23
-
 24
24 -
 25
25 -
 26
26 -
 27
27 -
 28
28 -
 29
29 -
 30
30 -
 31
31 -
 32
32 -
 33
33 -
 34
34 -
 35
35 -
 36
36 -
 37
37 -
 38
38 -
 39
39 -
 40
40 -
 41
41 -
 42
42 -
 43
43 -
 44
44 -
45
-
46
-
47
-
48
-
49
-
50
-
51
-
52
-
53
-
54
-
55
-
56
-
57
-
58
-
59
-
60
-
61
-
62
-
63
-
64
-
65
-
66
-
67
-
68
-
69
-
70
-
71
-
72
-
73
-
74
-
75
-
76
-
77
-
78
-
79
-
80
-
81
-
82
-
83
-
84
-
85
-
86
-
87
 |
 |

JETBLUE AIRWAYS CORPORATION-2015Annual Report30
PART II
ITEM7Management’s Discussion and Analysis of Financial Condition and Results of Operations
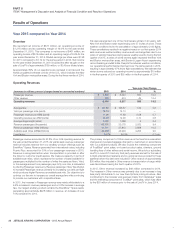
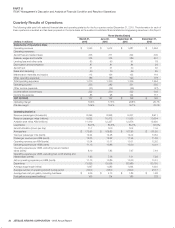
Quarterly Results of Operations
The following table sets forth selected financial data and operating statistics for the four quarters ended December31, 2015. The information for each of
these quarters is unaudited and has been prepared on the same basis as the audited consolidated financial statements appearing elsewhere in this Report.
(dollars in millions)
Three Months Ended
March 31,
2015
June 30,
2015
September 30,
2015
December 31,
2015
Statements of Operations Data:
Operating revenues $ 1,523 $ 1,612 $ 1,687 $ 1,594
Operating expenses:
Aircraft fuel and related taxes 335 371 342 300
Salaries, wages and benefits 375 375 389 401
Landing fees and other rents 83 90 91 78
Depreciation and amortization 87 81 84 93
Aircraft rent 31 31 30 30
Sales and marketing 60 70 69 65
Maintenance materials and repairs 113 126 132 119
Other operating expenses 186 186 199 178
Total operating expenses 1,270 1,330 1,336 1,264
Operating income 253 282 351 330
Other income (expense) (31) (32) (29) (27)
Income before income taxes 222 250 322 303
Income tax expense 85 98 124 113
NET INCOME $ 137 $ 152 $ 198 $ 190
Operating margin 16.6% 17.5% 20.8% 20.7%
Pre-tax margin 14.6% 15.5% 19.1% 19.0%
Operating Statistics:
Revenue passengers (thousands) 8,095 8,858 9,237 8,911
Revenue passenger miles (millions) 9,622 10,472 11,063 10,554
Available seat miles ASM (millions) 11,419 12,237 12,976 12,626
Load factor 84.3% 85.6% 85.3% 83.6%
Aircraft utilization (hours per day) 11.7 12.0 12.2 11.6
Average fare $ 173.96 $ 168.85 $ 167.96 $ 161.35
Yield per passenger mile (cents) 14.64 14.28 14.02 13.62
Passenger revenue per ASM (cents) 12.33 12.22 11.96 11.39
Operating revenue per ASM (cents) 13.34 13.17 13.01 12.62
Operating expense per ASM (cents) 11.13 10.86 10.30 10.01
Operating expense per ASM, excluding fuel and related
taxes (cents) 8.19 7.83 7.67 7.64
Operating expense per ASM, excluding fuel, profit sharing and
related taxes (cents) 7.95 7.56 7.31 7.29
Airline operating expense per ASM (cents) 11.13 10.86 10.30 10.01
Departures 73,823 79,558 82,989 80,135
Average stage length (miles) 1,097 1,085 1,094 1,093
Average number of operating aircraft during period 203.9 206.0 209.0 212.7
Average fuel cost per gallon, including fuel taxes $ 2.06 $ 2.13 $ 1.85 $ 1.68
Fuel gallons consumed (millions) 163 174 185 178