JetBlue Airlines 2015 Annual Report Download - page 30
Download and view the complete annual report
Please find page 30 of the 2015 JetBlue Airlines annual report below. You can navigate through the pages in the report by either clicking on the pages listed below, or by using the keyword search tool below to find specific information within the annual report.-
 1
1 -
2
-
3
-
4
-
5
-
6
-
7
-
8
-
9
-
10
-
11
-
12
-
13
-
14
-
15
-
16
-
17
-
18
-
19
-
 20
20 -
 21
21 -
 22
22 -
 23
23 -
 24
24 -
 25
25 -
 26
26 -
 27
27 -
 28
28 -
 29
29 -
 30
30 -
 31
31 -
 32
32 -
 33
33 -
 34
34 -
 35
35 -
 36
36 -
 37
37 -
 38
38 -
 39
39 -
 40
40 -
41
-
42
-
43
-
44
-
45
-
46
-
47
-
48
-
49
-
50
-
51
-
52
-
53
-
54
-
55
-
56
-
57
-
58
-
59
-
60
-
61
-
62
-
63
-
64
-
65
-
66
-
67
-
68
-
69
-
70
-
71
-
72
-
73
-
74
-
75
-
76
-
77
-
78
-
79
-
80
-
81
-
82
-
83
-
84
-
85
-
86
-
87
 |
 |

JETBLUE AIRWAYS CORPORATION-2015Annual Report26
PART II
ITEM7Management’s Discussion and Analysis of Financial Condition and Results of Operations
Results of Operations
Year 2015 compared to Year 2014
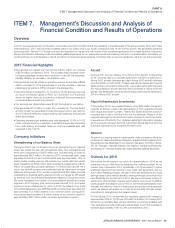
Overview
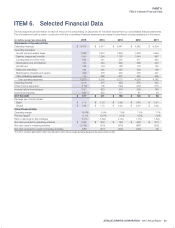
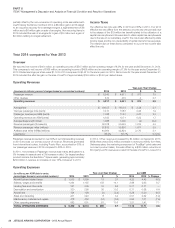
We reported net income of $677 million, an operating income of
$1,216 million and an operating margin of 19.0% for the year ended
December 31, 2015. This compares to net income of $401 million, an
operating income of $515 million and an operating margin of 8.9% for the
year ended December 31, 2014. Diluted earnings per share were $1.98
for 2015 compared to $1.19 for the same period in 2014. Net income
for the year ended December 31, 2014 included the after tax gain on the
sale of LiveTV of approximately $169 million, or $0.49 per diluted share.
Approximately 80% of our operations are centered in and around the
heavily populated northeast corridor of the U.S., which includes the New
York and Boston metropolitan areas. During the first three months of 2014,
this area experienced one of the most severe winters in 20 years, with
New York and Boston each experiencing over 57 inches of snow. These
weather conditions led to the cancellation of approximately 4,100 flights.
These cancellations resulted in a negative impact on our first quarter 2014
seat revenue as well as ancillary revenue such as change fees due to our
policy of waiving these fees during severe weather events. During the first
quarter of 2015, a series of winter storms again impacted the New York
and Boston metropolitan areas, with Boston’s Logan Airport experiencing
record breaking snowfall totals. Despite the adverse weather conditions,
our operational performance improved over the same period in 2014,
resulting in approximately 37% fewer flight cancellations. We estimate that
winter storms reduced our operating income by approximately $10 million
in the first quarter of 2015 and $35 million in the first quarter of 2014.
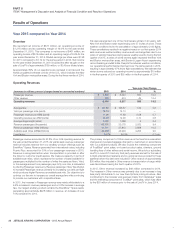
Operating Revenues
(revenues in millions; percent changes based on unrounded numbers)
Year-over-Year Change
2015 2014 $ %
Passenger revenue $ 5,893 $ 5,343 550 10.3
Other revenue 523 474 49 10.4
Operating revenues 6,416 5,817 599 10.3
Average fare $ 167.89 $ 166.57 1.32 0.8
Yield per passenger mile (cents) 14.13 14.13 — —
Passenger revenue per ASM (cents) 11.96 11.88 0.08 0.7
Operating revenue per ASM (cents) 13.03 12.93 0.10 0.8
Average stage length (miles) 1,092 1,088 4 0.4
Revenue passengers (thousands) 35,101 32,078 3,023 9.4
Revenue passenger miles (millions) 41,711 37,813 3,898 10.3
Available seat miles (ASMs)(millions) 49,258 44,994 4,264 9.5
Load factor 84.7% 84.0% 0.7 pts
Passenger revenue accounted for 91.8% of our total operating revenue for
the year ended December31, 2015. As well as seat revenue, passenger
revenue includes revenue from our ancillary product offerings such as
EvenMore™ Space. Revenue generated from international routes, including
Puerto Rico, accounted for 30% of our passenger revenues in 2015.
Revenue is recognized either when transportation is provided or after
the ticket or customer credit expires. We measure capacity in terms of
available seat miles, which represents the number of seats available for
passengers multiplied by the number of miles the seats are flown. Yield,
or the average amount one passenger pays to fly one mile, is calculated
by dividing Passenger revenue by Revenue passenger miles. We attempt
to increase Passenger revenue primarily by increasing our yield per flight
which produces higher Revenue per available seat mile. Our objective is to
optimize our fare mix to increase our overall average fare while continuing
to provide our customers with competitive fares.
In 2015, the increase in Passenger revenue was mainly attributable to a
9.4% increase in revenue passengers and a 0.8% increase in average
fare. Our largest ancillary product remains the EvenMore
™
Space seats,
generating approximately $228 million in revenue, an increase of over
14% compared to 2014.
The primary component of Other revenue is the fees from reservation
changes and excess baggage charged to customers in accordance
with our published policies. We also include the marketing component
of TrueBlue® point sales, on-board product sales, charters, ground
handling fees of other airlines and rental income. We sold our subsidiary,
LiveTV, in June 2014 and any third party revenues earned for the sale of
in-flight entertainment systems and on-going services provided for these
systems before this date were included in Other revenue of approximately
$30 million. Also included in Other revenue is transportation of cargo which
was discontinued during the fourth quarter of 2015.
In 2015, Other revenue increased by $49 million compared to 2014.
The increase in Other revenue was primarily due to an increase in bag
fees partly attributable to our new Fare Options pricing structure. Also
contributing to the increase was revenues mainly from Getaways™ sales
and the marketing component of TrueBlue
®
point sales, which was offset
by the $30 million of revenue prior to the sale of LiveTV in June 2014.