Hyundai 2003 Annual Report Download - page 53
Download and view the complete annual report
Please find page 53 of the 2003 Hyundai annual report below. You can navigate through the pages in the report by either clicking on the pages listed below, or by using the keyword search tool below to find specific information within the annual report.-
 1
1 -
2
-
3
-
4
-
5
-
6
-
7
-
8
-
9
-
10
-
11
-
12
-
13
-
14
-
15
-
16
-
17
-
18
-
19
-
20
-
21
-
22
-
23
-
24
-
25
-
26
-
27
-
28
-
29
-
30
-
31
-
32
-
33
-
34
-
35
-
36
-
37
-
38
-
39
-
40
-
41
-
42
-
 43
43 -
 44
44 -
 45
45 -
 46
46 -
 47
47 -
 48
48 -
 49
49 -
 50
50 -
 51
51 -
 52
52 -
 53
53 -
 54
54 -
 55
55 -
 56
56 -
 57
57 -
 58
58
 |
 |
Hyundai Motor Company Annual Report 2003 _104103_Hyundai Motor Company Annual Report 2003
HYUNDAI MOTOR COMPANY AND SUBSIDIARIES HYUNDAI MOTOR COMPANY AND SUBSIDIARIES
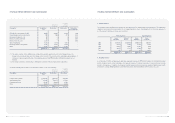
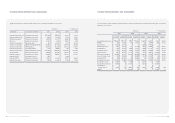
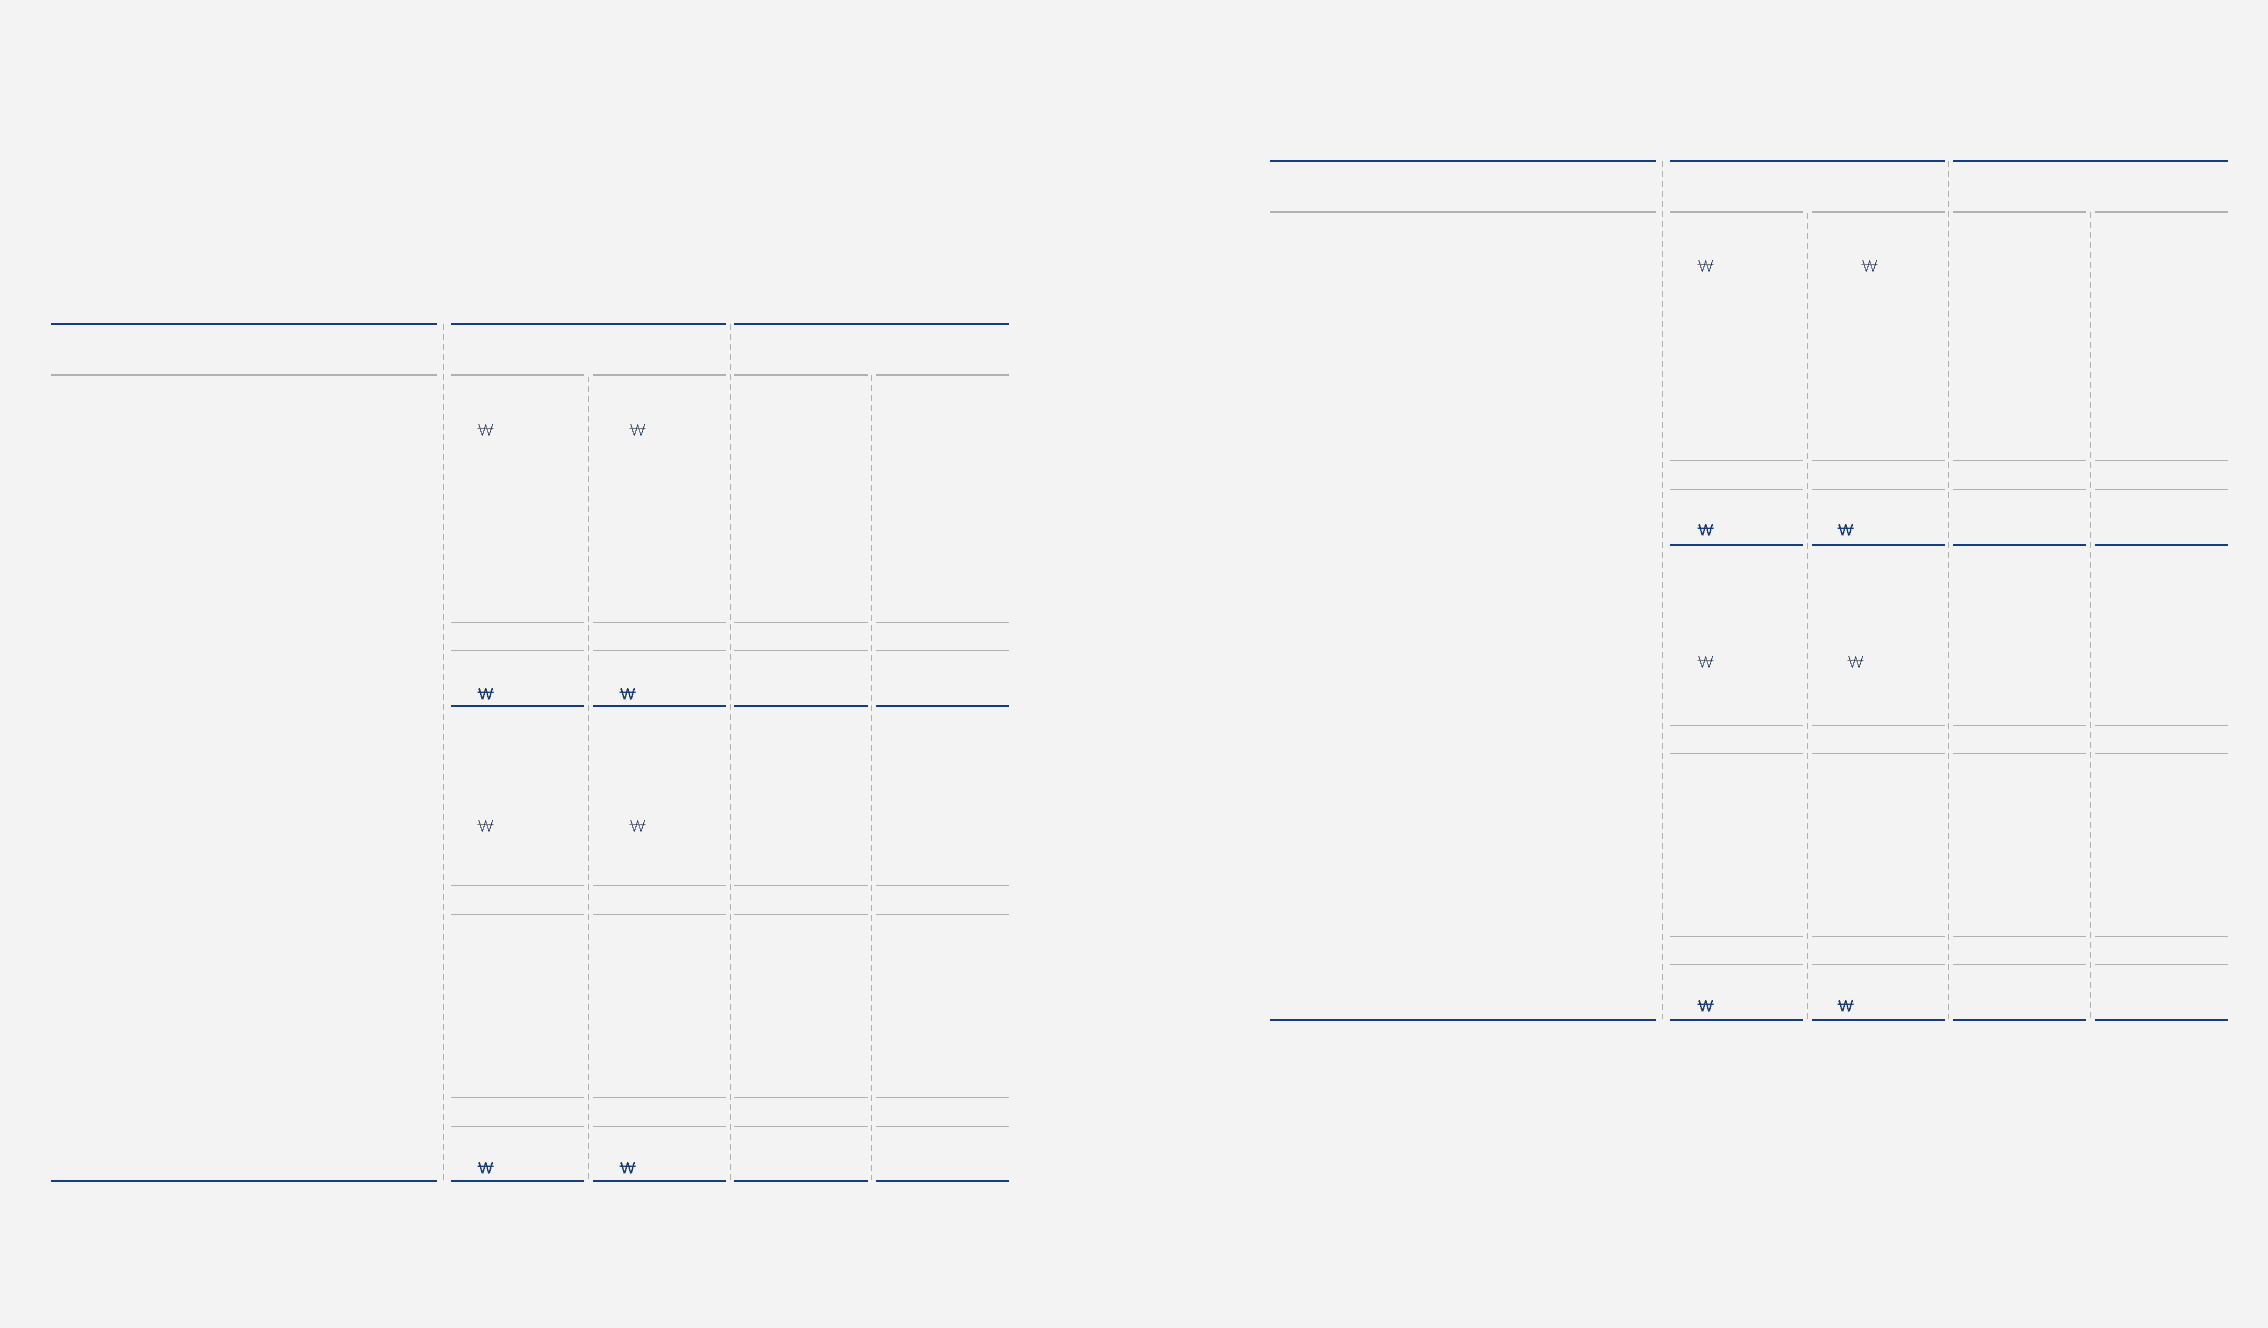
25. SEGMENT INFORMATION
(1) Consolidated financial statements by industry
The consolidated balance sheets as of December 31, 2003 and 2002, and consolidated statements of income for the years
then ended, by industry under which the Company and its subsidiaries’ business are classified, are as follows:
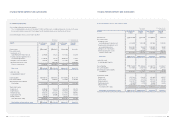
Consolidated Balance Sheet as of December 31, 2003
Consolidated Balance Sheet as of December 31, 2002
ASSETS Non-financial Financial Non-financial Financial
industry industry industry industry
Current assets: 19,143,071 1,454,071 $15,981,860 $1,213,951
Non-current assets:
Investments, net of
unamortized present value discount 9,476,086 514,252 7,911,242 429,330
Property, plant and equipment, net of
accumulated depreciation 17,729,546 133,755 14,801,758 111,667
Intangibles, net of amortization 1,643,366 9,486 1,371,987 7,920
Other financial business assets - 9,681,586 - 8,082,807
Total non-current assets 28,848,998 10,339,079 24,084,987 8,631,724
Total assets 47,992,069 11,793,150 $40,066,847 $9,845,675
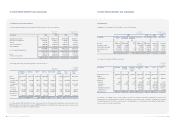
LIABILITIES AND
SHAREHOLDERS’ EQUITY
Current liabilities 18,889,131 7,469,636 $15,769,854 $6,236,129
Non-current liabilities 8,833,298 3,350,055 7,374,602 2,796,840
Other financial business liabilities - - - -
Total liabilities 27,722,429 10,819,691 23,144,456 9,032,969
Shareholders’ equity:
Capital stock 4,670,695 1,153,978 3,899,395 963,414
Capital surplus 7,024,204 287,897 5,864,254 240,355
Retained earnings 6,266,457 (675,422) 5,231,639 (563,885)
Capital adjustments 1,417,994 207,006 1,183,832 172,822
Minority interests 890,290 - 743,271 -
Total shareholders’ equity 20,269,640 973,459 16,922,391 812,706
Total liabilities and shareholders’ equity 47,992,069 11,793,150 $40,066,847 $9,845,675
Korean won
(in millions)
U. S. dollars (Note 2)
(in thousands)
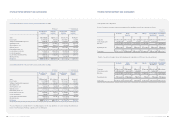
ASSETS Non-financial Financial Non-financial Financial
industry industry industry industry
Current assets: 14,445,860 665,305 $12,060,327 $555,439
Non-current assets:
Investments, net of
unamortized present value discount 3,439,440 1,352,270 2,871,465 1,128,961
Property, plant and equipment, net of
accumulated depreciation 16,636,969 108,269 13,889,605 90,390
Intangibles, net of amortization 1,670,883 5,849 1,394,960 4,883
Other financial business assets - 8,386,928 - 7,001,944
Total non-current assets 21,747,292 9,853,316 18,156,030 8,226,178
Total assets 36,193,152 10,518,621 $30,216,357 $8,781,617
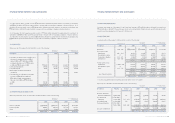
LIABILITIES AND
SHAREHOLDERS’ EQUITY
Current liabilities 14,719,420 6,140,458 $12,288,713 $5,126,447
Non-current liabilities 8,211,003 3,566,741 6,855,070 2,977,743
Other financial business liabilities - 12,732 - 10,630
Total liabilities 22,930,423 9,719,931 19,143,783 8,114,820
Shareholders’ equity:
Capital stock 1,475,312 476,182 1,231,685 397,547
Capital surplus 5,287,270 43,721 4,414,151 36,501
Retained earnings 3,561,797 286,405 2,973,616 239,109
Capital adjustments (81,940) (7,618) (68,409) (6,360)
Minority interests 3,020,290 - 2,521,531 -
Total shareholders’ equity 13,262,729 798,690 11,072,574 666,797
Total liabilities and shareholders’ equity 36,193,152 10,518,621 $30,216,357 $8,781,617
Korean won
(in millions)
U. S. dollars (Note 2)
(in thousands)