Hyundai 2003 Annual Report Download - page 31
Download and view the complete annual report
Please find page 31 of the 2003 Hyundai annual report below. You can navigate through the pages in the report by either clicking on the pages listed below, or by using the keyword search tool below to find specific information within the annual report.-
 1
1 -
2
-
3
-
4
-
5
-
6
-
7
-
8
-
9
-
10
-
11
-
12
-
13
-
14
-
15
-
16
-
17
-
18
-
19
-
20
-
 21
21 -
 22
22 -
 23
23 -
 24
24 -
 25
25 -
 26
26 -
 27
27 -
 28
28 -
 29
29 -
 30
30 -
 31
31 -
 32
32 -
 33
33 -
 34
34 -
 35
35 -
 36
36 -
 37
37 -
 38
38 -
 39
39 -
 40
40 -
 41
41 -
42
-
43
-
44
-
45
-
46
-
47
-
48
-
49
-
50
-
51
-
52
-
53
-
54
-
55
-
56
-
57
-
58
 |
 |
Hyundai Motor Company Annual Report 2003 _6059_Hyundai Motor Company Annual Report 2003
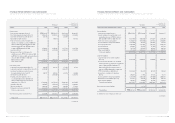
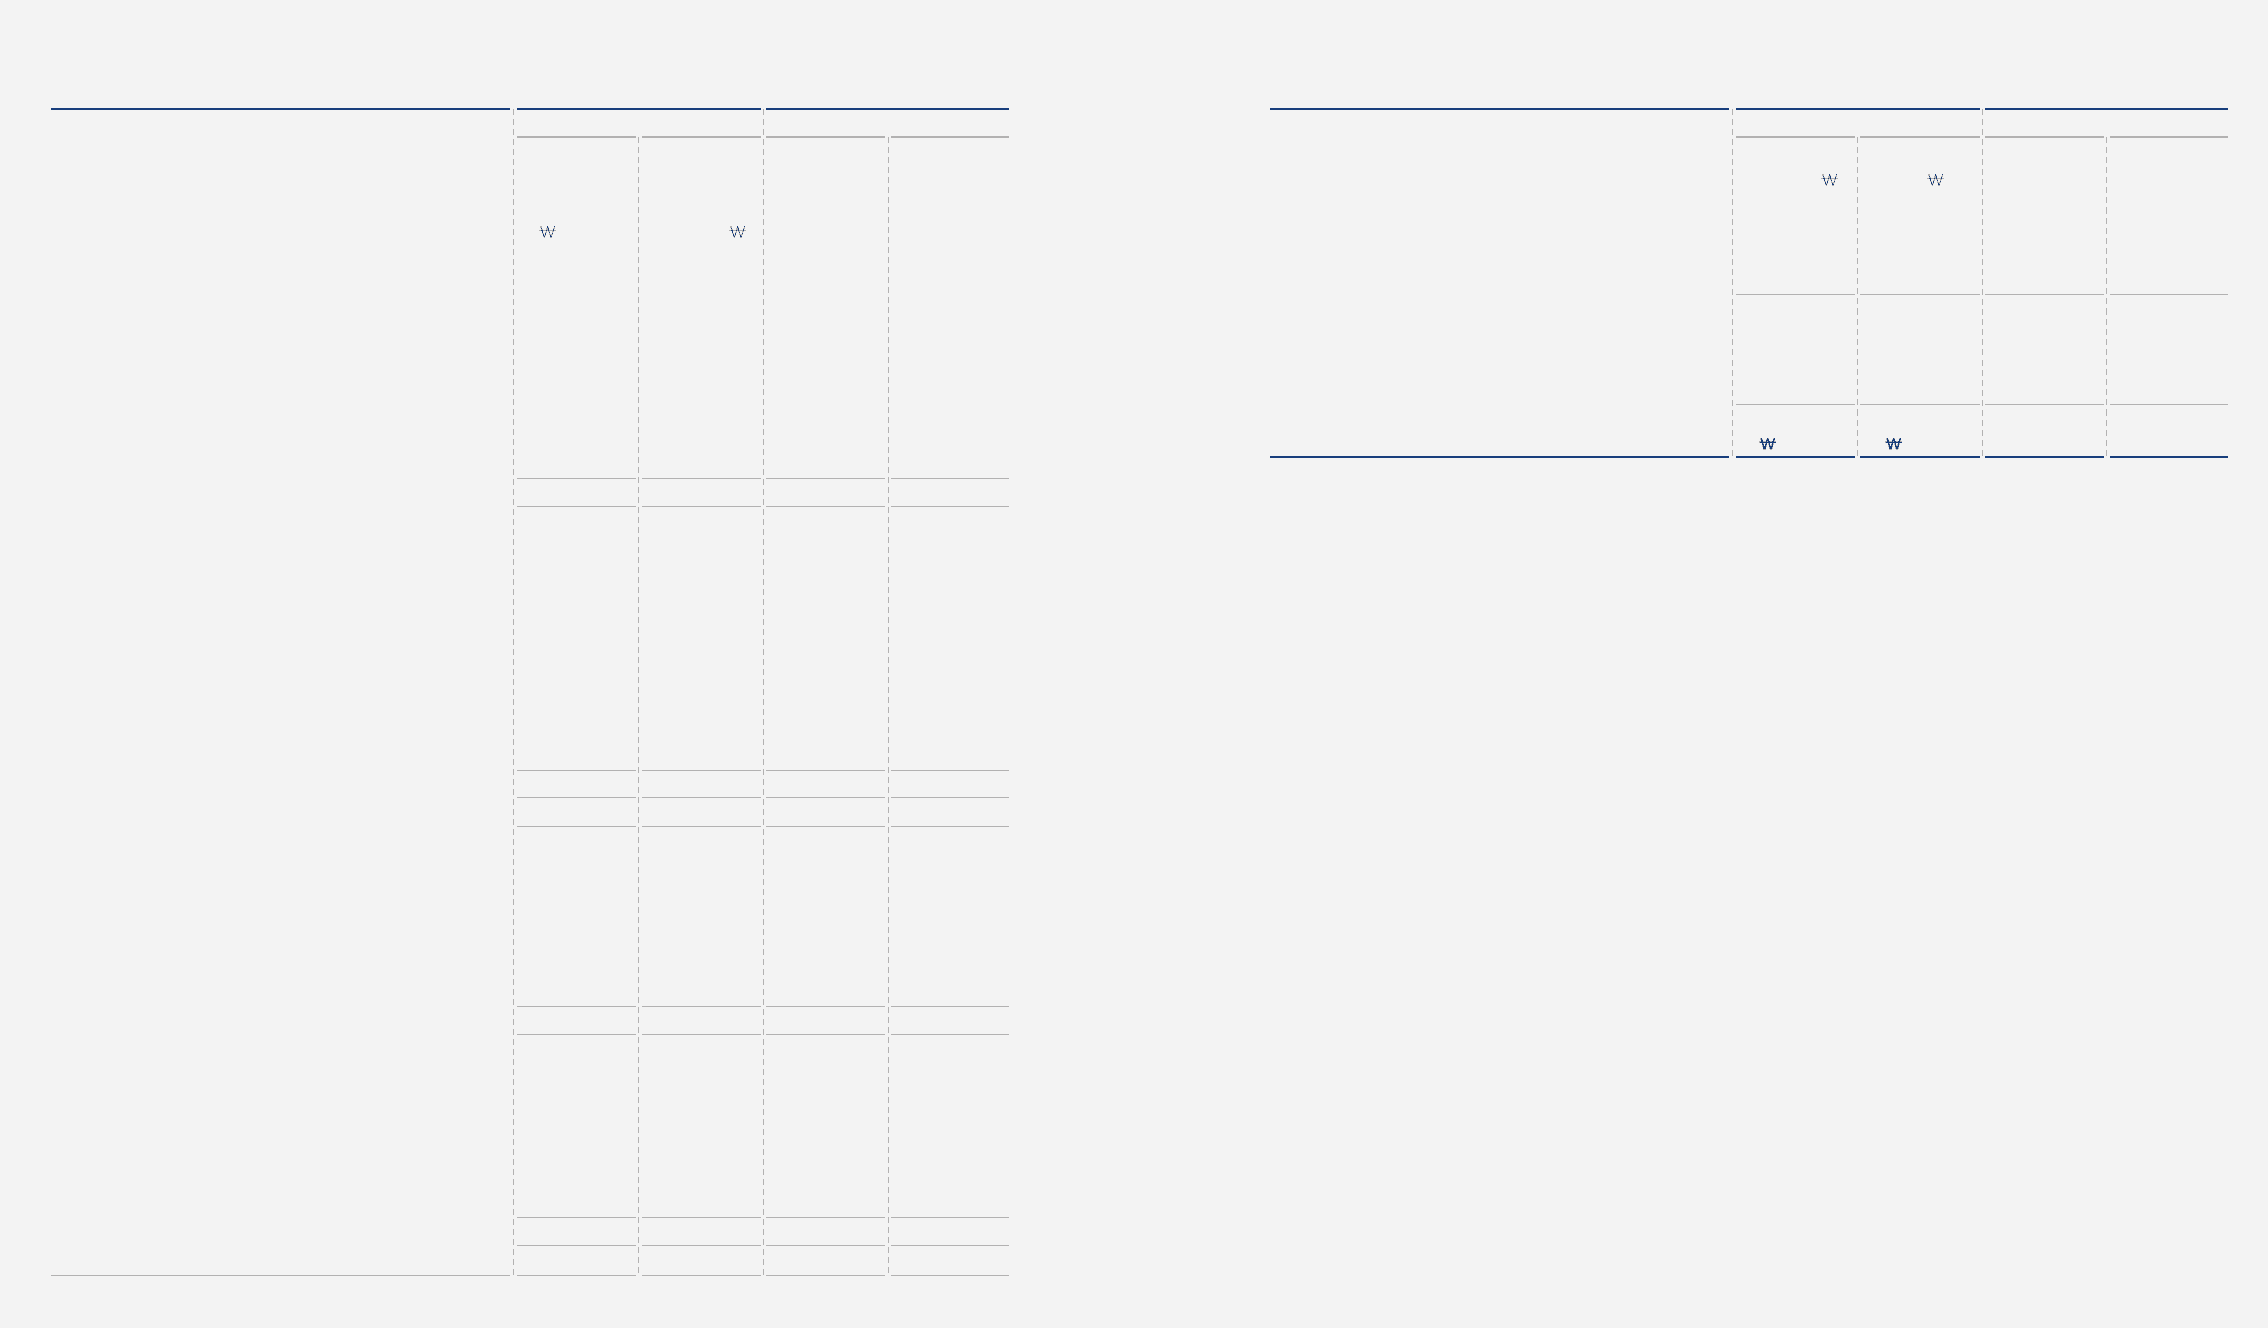
HYUNDAI MOTOR COMPANY AND SUBSIDIARIES
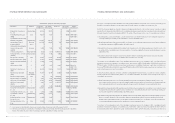
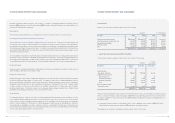
CONSOLIDATED STATEMENTS OF CASH FLOWS (CONTINUED)
FOR THE YEARS ENDED DECEMBER 31, 2003 AND 2002
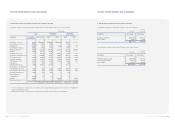
HYUNDAI MOTOR COMPANY AND SUBSIDIARIES
CONSOLIDATED STATEMENTS OF CASH FLOWS (CONTINUED)
FOR THE YEARS ENDED DECEMBER 31, 2003 AND 2002
2003 2002 2003 2002
Cash flows from investing activities:
Cash inflows from investing activities:
Proceeds from disposal of short-term investment
securities 4,483,700 - $3,743,279 $ -
Proceeds from disposal of marketable securities - 6,487,542 - 5,416,214
Reduction in short-term financial instruments
and other current assets 7,854,036 4,442,551 6,557,051 3,708,926
Proceeds from disposal of long-term investment
securities 5,245,529 - 4,379,303 -
Proceeds from disposal of investments - 307,792 - 256,964
Reduction in other assets 670,947 280,860 560,150 234,481
Proceeds from disposal of property, plant and
equipment 196,153 183,709 163,761 153,372
18,450,365 11,702,454 15,403,544 9,769,957
Cash outflows from investing activities:
Purchase of short-term financial instruments (7,728,526) (6,318,491) (6,452,267) (5,275,080)
Acquisition of short-term investment securities (4,084,863) - (3,410,305) -
Acquisition of marketable securities - (6,271,525) - (5,235,870)
Additions to other current assets (135,126) (42,308) (112,812) (35,321)
Acquisition of long-term investment securities (2,699,658) - (2,253,847) -
Acquisition of investments - (821,821) - (686,109)
Additions to other assets (1,245,987) (222,059) (1,040,231) (185,390)
Acquisition of property, plant and equipment (2,830,903) (1,686,611) (2,363,418) (1,408,091)
Expenditures for development costs (391,349) (291,690) (326,723) (243,521)
(19,116,412) (15,654,505) (15,959,603) (13,069,382)
(666,047) (3,952,051) (556,059) (3,299,425)
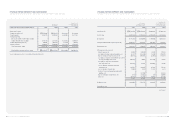
Cash flows from financing activities:
Cash inflows from financing activities:
Proceeds from short-term borrowings 6,990,449 21,315,448 5,836,074 17,795,499
Proceeds from long-term debt 4,246,163 4,993,859 3,544,968 4,169,193
Proceeds from issuance of stock 236,816 58,761 197,709 49,057
Proceeds from disposal of treasury stock 86,502 4,931 72,217 4,117
Others 194,262 20,647 162,183 17,237
11,754,192 26,393,646 9,813,151 22,035,103
Cash outflows from financing activities:
Repayment of short-term borrowings (5,972,761) (20,629,745) (4,986,443) (17,223,030)
Payment of current maturities of long-term debt (3,152,809) (2,768,331) (2,632,166) (2,311,180)
Payment of cash dividends (395,989) (276,089) (330,597) (230,497)
Repayment of long-term debt (856,872) (1,916,307) (715,372) (1,599,856)
Purchase of treasury stock (192,957) (20,215) (161,093) (16,877)
Others (120,746) (125,460) (100,806) (104,741)
(10,692,134) (25,736,147) (8,926,477) (21,486,181)
1,062,058 657,499 886,674 548,922
(continued)
Korean won
(in millions)
Translation into
U. S. dollars (Note 2)
(in thousands)
2003 2002 2003 2002
Effect of cash due to the merger - (63) $ - $ (52)
Effect of exchange rate on cash 55,623 (27,028) 46,438 (22,564)
Effect of change in consolidated subsidiaries 267,184 55,353 223,062 46,212
Net increase in cash and cash equivalents 1,997,580 461,448 1,667,707 385,247
Cash and cash equivalents, beginning of year 2,765,872 2,304,424 2,309,127 1,923,880
Cash and cash equivalents, end of year 4,763,452 2,765,872 $3,976,834 $2,309,127
See accompanying notes to consolidated financial statements.
Korean won
(in millions)
Translation into
U. S. dollars (Note 2)
(in thousands)