Hyundai 2003 Annual Report Download - page 29
Download and view the complete annual report
Please find page 29 of the 2003 Hyundai annual report below. You can navigate through the pages in the report by either clicking on the pages listed below, or by using the keyword search tool below to find specific information within the annual report.-
 1
1 -
2
-
3
-
4
-
5
-
6
-
7
-
8
-
9
-
10
-
11
-
12
-
13
-
14
-
15
-
16
-
17
-
18
-
 19
19 -
 20
20 -
 21
21 -
 22
22 -
 23
23 -
 24
24 -
 25
25 -
 26
26 -
 27
27 -
 28
28 -
 29
29 -
 30
30 -
 31
31 -
 32
32 -
 33
33 -
 34
34 -
 35
35 -
 36
36 -
 37
37 -
 38
38 -
 39
39 -
40
-
41
-
42
-
43
-
44
-
45
-
46
-
47
-
48
-
49
-
50
-
51
-
52
-
53
-
54
-
55
-
56
-
57
-
58
 |
 |

Hyundai Motor Company Annual Report 2003 _5655_Hyundai Motor Company Annual Report 2003
HYUNDAI MOTOR COMPANY AND SUBSIDIARIES
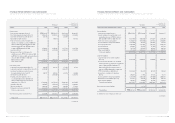
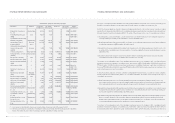
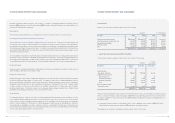
CONSOLIDATED STATEMENTS OF INCOME (CONTINUED)
FOR THE YEARS ENDED DECEMBER 31, 2003 AND 2002
2003 2002 2003 2002
Income before income tax 2,669,048 2,742,797 $2,228,291 $2,289,862
Income tax expense (Note 19) 652,439 844,344 544,698 704,912
Income before minority interests 2,016,609 1,898,453 1,683,593 1,584,950
Minority interests (241,128) (464,058) (201,308) (387,425)
Net income 1,775,481 1,434,395 $1,482,285 $1,197,525
Ordinary income per ordinary common share 7,845 6,313 $6.55 $5.27
Earnings per ordinary common share 7,845 6,313 $6.55 $5.27
Ordinary income per fully diluted common share 7,820 6,290 $6.53 $5.25
Earnings per fully diluted common share 7,820 6,290 $6.53 $5.25
See accompanying notes to consolidated financial statements.
Korean won
(in millions, except
per share amounts)
Translation into
U. S. dollars (Note 2)
(in thousands, except
per share amounts)
HYUNDAI MOTOR COMPANY AND SUBSIDIARIES
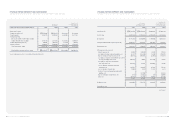
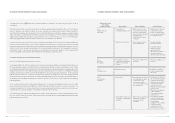
CONSOLIDATED STATEMENTS OF CHANGES IN SHAREHOLDERS’ EQUITY
FOR THE YEARS ENDED DECEMBER 31, 2003 AND 2002
Capital Capital Retained Capital Minority Total Total
stock surplus earnings adjustments interests amount amount
January 1, 2002 1,476,454 5,306,332 2,473,940 (65,435) 2,512,837 11,704,128 $9,771,354
Additional investment in
subsidiaries - (24,222) - - - (24,222) (20,222)
Disposal of treasury stock - (18) - - - (18) (15)
Merger between subsidiaries - - 1,785 - - 1,785 1,490
Application of the equity
method - - (1,219) - - (1,219) (1,018)
Effect of change in the scope
of consolidation - (588) 590 1,906 52,300 54,208 45,256
Effect of change in the scope
of equity method - - - (3,182) - (3,182) (2,657)
Payment of cash dividends
(Note 19) - - (215,145) - (5,002) (220,147) (183,793)
Net income - - 1,434,395 - - 1,434,395 1,197,525
Treasury stock - - - (6,867) - (6,867) (5,733)
Discount on stock issuance - 1 - 248 - 249 208
Loss on valuation of
investment equity securities - - - (4,704) - (4,704) (3,927)
Stock options - - - (82) - (82) (68)
Cumulative translation debits - - - (67,578) - (67,578) (56,418)
Loss on transaction of
derivatives - - - 39,277 - 39,277 32,791
Effect of change
in the minority interests - - - - 543,866 543,866 454,054
Others - 4,556 (16,363) - - (11,807) (9,857)
December 31, 2002 1,476,454 5,286,061 3,677,983 (106,417) 3,104,001 13,438,082 $11,218,970
(continued)
Korean won
(in millions)
Translation into
U.S. dollars (Note 2)
(in thousands)