Hyundai 2003 Annual Report Download - page 30
Download and view the complete annual report
Please find page 30 of the 2003 Hyundai annual report below. You can navigate through the pages in the report by either clicking on the pages listed below, or by using the keyword search tool below to find specific information within the annual report.-
 1
1 -
2
-
3
-
4
-
5
-
6
-
7
-
8
-
9
-
10
-
11
-
12
-
13
-
14
-
15
-
16
-
17
-
18
-
19
-
 20
20 -
 21
21 -
 22
22 -
 23
23 -
 24
24 -
 25
25 -
 26
26 -
 27
27 -
 28
28 -
 29
29 -
 30
30 -
 31
31 -
 32
32 -
 33
33 -
 34
34 -
 35
35 -
 36
36 -
 37
37 -
 38
38 -
 39
39 -
 40
40 -
41
-
42
-
43
-
44
-
45
-
46
-
47
-
48
-
49
-
50
-
51
-
52
-
53
-
54
-
55
-
56
-
57
-
58
 |
 |
Hyundai Motor Company Annual Report 2003 _5857_Hyundai Motor Company Annual Report 2003
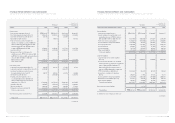
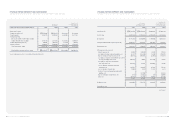
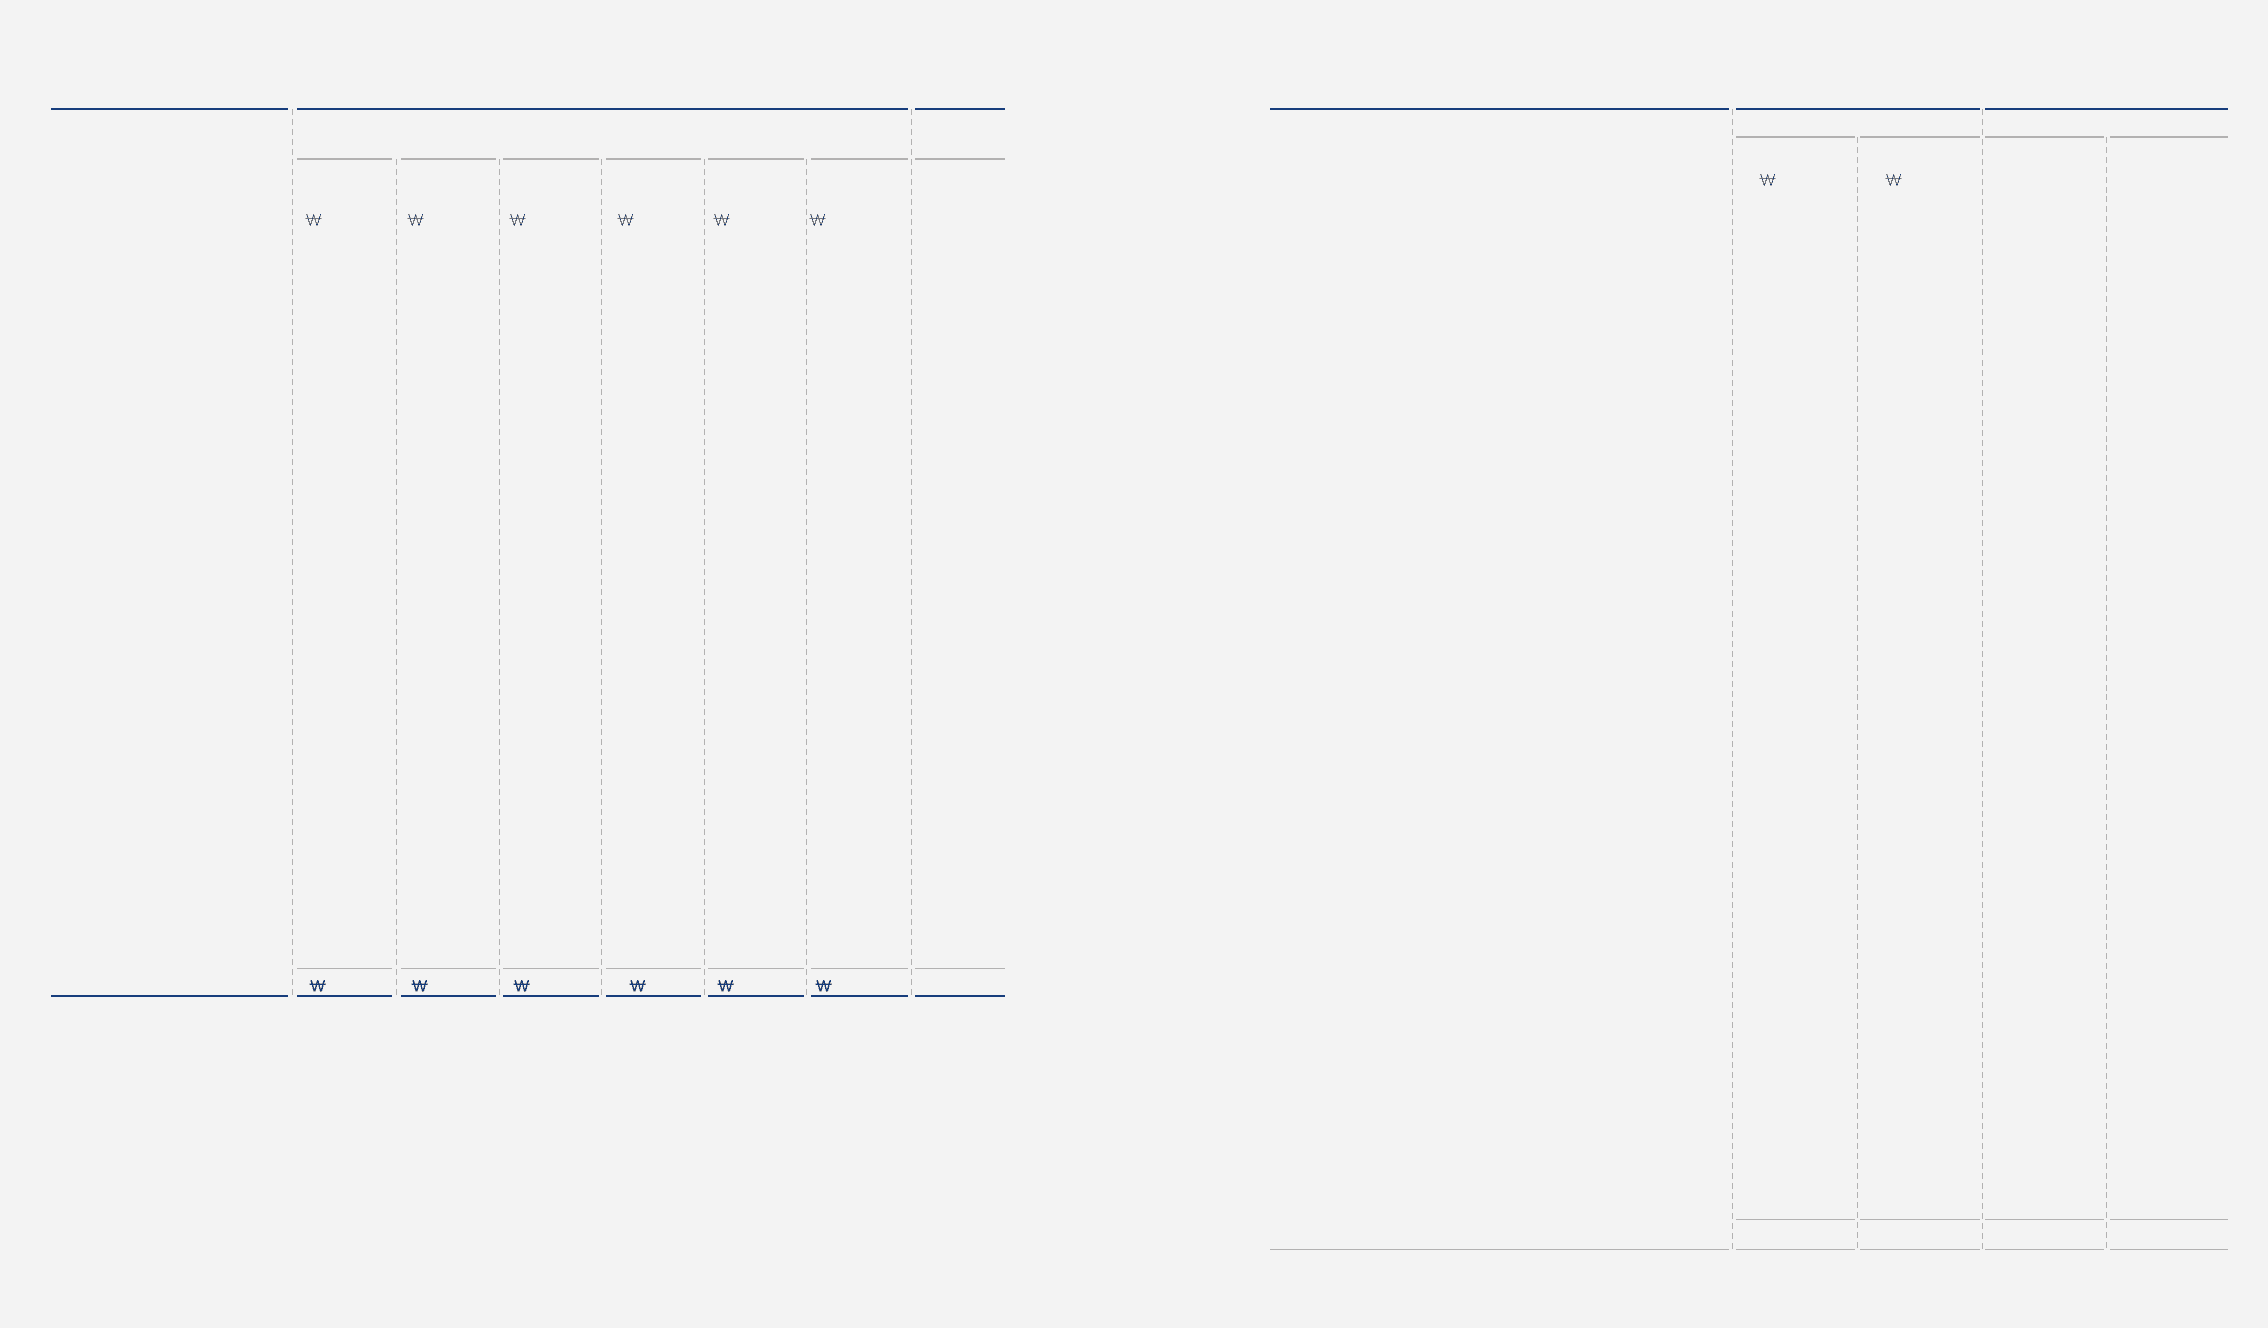
HYUNDAI MOTOR COMPANY AND SUBSIDIARIES
CONSOLIDATED STATEMENTS OF CHANGES IN SHAREHOLDERS’ EQUITY (CONTINUED)
FOR THE YEARS ENDED DECEMBER 31, 2003 AND 2002
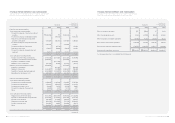
HYUNDAI MOTOR COMPANY AND SUBSIDIARIES
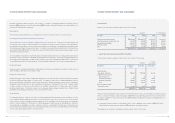
CONSOLIDATED STATEMENTS OF CASH FLOWS FOR THE YEARS ENDED DECEMBER 31, 2003 AND 2002
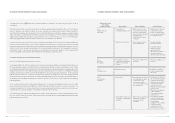
Capital Capital Retained Capital Minority Total Total
stock surplus earnings adjustments interests amount amount
January 1, 2003 1,476,454 5,286,061 3,677,983 (106,417) 3,104,001 13,438,082 $11,218,970
Additional investment in
subsidiaries - (124,104) - - 46,168 (77,936) (65,066)
Disposal of subsidiaries’ stock - 138,579 (1) - - 138,578 115,694
Extinguishment of treasury
stock by surplus - - (58,367) 9,172 (49,878) (99,073) (82,712)
Application of the equity
method - - 20,741 - - 20,741 17,316
Effect of change in the scope
of consolidation - (17,159) (45,326) - 131,065 68,580 57,255
Effect of change in the scope
of equity method - - (44,149) - - (44,149) (36,858)
Payment of cash dividends
(Note 19) - - (243,079) - (48,096) (291,175) (243,092)
Net income - - 1,775,481 - - 1,775,481 1,482,285
Treasury stock - 15,220 - (15,848) - (628) (524)
Discount on stock issuance - - (171) (2,641) - (2,812) (2,348)
Gain on valuation of
available-for-sale securities - - - 550,328 - 550,328 459,449
Gain on valuation of
investment equity securities - - - 11,380 - 11,380 9,501
Stock options 2,149 - - 3,061 - 5,210 4,350
Cumulative effect of foreign
currency translation - - - 38,420 - 38,420 32,075
Loss on transaction of
derivatives - - - (106,763) - (106,763) (89,133)
Effect of change in the
minority interests - - - - 241,128 241,128 201,309
Others - 30,178 64,663 - 494,469 589,310 491,993
December 31, 2003 1,478,603 5,328,775 5,147,775 380,692 3,918,857 16,254,702 $13,570,464
See accompanying notes to consolidated financial statements.
Korean won
(in millions)
Translation into
U.S. dollars (Note 2)
(in thousands)
2003 2002 2003 2002
Cash flows from operating activities:
Net income 1,775,481 1,434,395 $1,482,285 $1,197,525
Adjustments to reconcile net income to net cash
provided by operating activities:
Depreciation 1,437,823 1,537,250 1,200,387 1,283,395
Loss (gain) on foreign currency translation, net 65,305 (131,965) 54,521 (110,173)
Loss (gain) on disposal of investments, net (127,567) 63,971 (106,501) 53,407
Loss (gain) on valuation of investments accounted
for using the equity method, net (169,161) 70,065 (141,226) 58,495
Loss on disposal of property, plant and equipment, net 273,696 206,424 228,498 172,336
Loss on valuation of inventories 15,001 5,331 12,524 4,451
Loss (gain) on redemption of debentures, net 115 (37,022) 96 (30,908)
Loss on impairment of investments 45,590 40,850 38,061 34,104
Loss on disposal of trade receivables 77,926 88,006 65,058 73,473
Amortization of discount on debentures 41,193 68,157 34,391 56,902
Amortization of intangibles, net 488,954 830,727 408,210 693,544
Provision for severance benefits 591,737 753,464 494,020 629,040
Provision for warranties and product liability 1,463,308 1,765,807 1,221,662 1,474,209
Provision for doubtful accounts 1,533,664 592,345 1,280,401 494,527
Amortization of present value discount accounts (107,948) (13,245) (90,122) (11,059)
Net income (loss) on minority interests (4,793) 464,058 (4,002) 387,425
Changes in operating assets and liabilities:
Increase in trade notes and accounts
receivable (1,631,248) (1,076,727) (1,361,870) (898,921)
Decrease in advances 136,828 158,826 114,233 132,598
Increase in inventories (1,412,848) (310,670) (1,179,536) (259,367)
Decrease (increase) in other current assets (94,041) 63,411 (78,512) 52,940
Decrease in long-term notes and accounts receivables 4,346 10,906 3,628 9,105
Increase in deferred income tax assets (1,158,341) (32,119) (967,057) (26,815)
Increase in other financial business assets (1,666,097) (4,114,688) (1,390,964) (3,435,205)
Increase (decrease) in trade notes and accounts payable (464,741) 1,630,804 (387,995) 1,361,500
Increase (decrease) in accounts payable-other (385,383) 846,440 (321,742) 706,662
Increase (decrease) in other current liabilities 487,079 (239,565) 406,645 (200,004)
Increase in individual severance insurance deposits (19,526) (266,017) (16,302) (222,088)
Decrease in accrued warranties and accrued
product liabilities (129,315) (143,349) (107,960) (119,677)
Decrease in accrued loss on valuation of derivatives (961) (38,318) (802) (31,990)
Increase in cumulative translation debits, net (70,830) (1,282) (59,134) (1,070)
Increase (decrease) in deferred income tax liabilities 786,795 (103,728) 656,867 (86,599)
Payment of severance benefits (406,840) (308,575) (339,656) (257,618)
Others (96,439) (86,229) (80,514) (71,990)
1,278,762 3,727,738 1,067,592 3,112,154
(continued)
Korean won
(in millions)
Translation into
U. S. dollars (Note 2)
(in thousands)