Hyundai 2003 Annual Report Download - page 27
Download and view the complete annual report
Please find page 27 of the 2003 Hyundai annual report below. You can navigate through the pages in the report by either clicking on the pages listed below, or by using the keyword search tool below to find specific information within the annual report.-
 1
1 -
2
-
3
-
4
-
5
-
6
-
7
-
8
-
9
-
10
-
11
-
12
-
13
-
14
-
15
-
16
-
 17
17 -
 18
18 -
 19
19 -
 20
20 -
 21
21 -
 22
22 -
 23
23 -
 24
24 -
 25
25 -
 26
26 -
 27
27 -
 28
28 -
 29
29 -
 30
30 -
 31
31 -
 32
32 -
 33
33 -
 34
34 -
 35
35 -
 36
36 -
 37
37 -
38
-
39
-
40
-
41
-
42
-
43
-
44
-
45
-
46
-
47
-
48
-
49
-
50
-
51
-
52
-
53
-
54
-
55
-
56
-
57
-
58
 |
 |

51_Hyundai Motor Company Annual Report 2003 Hyundai Motor Company Annual Report 2003 _52
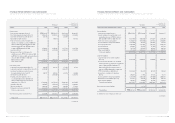
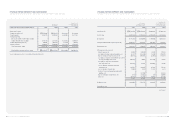
HYUNDAI MOTOR COMPANY AND SUBSIDIARIES
CONSOLIDATED BALANCE SHEETS AS OF DECEMBER 31, 2003 AND 2002
ASSETS 2003 2002 2003 2002
Current assets:
Cash and cash equivalents (Note 17) 4,763,452 2,765,872 $3,976,834 $2,309,127
Short-term financial instruments (Note 17) 4,054,421 3,610,223 3,384,890 3,014,045
Short-term investment securities (Note 4) 393,798 - 328,768 -
Marketable securities (Note 6) - 710,474 - 593,149
Trade notes and accounts receivable, less
allowance for doubtful accounts of 284,470
million in 2003 and 289,549 million in 2002,
and unamortized discount of 1,201 million
in 2003 and 2,820 million in 2002 2,703,821 2,198,905 2,257,323 1,835,786
Inventories (Note 3) 5,498,529 3,819,999 4,590,523 3,189,179
Advances and other, net of allowance for
doubtful accounts of 177,355 million in 2003
and 165,122 million in 2002, and unamortized
discount of 5,735 million in 2003 and
9,639 million in 2002 1,918,753 2,005,079 1,601,898 1,673,968
Total current assets 19,332,774 15,110,552 16,140,236 12,615,254
Non-current assets:
Long-term financial instruments (Note 17) 208,300 102,195 173,902 85,319
Long-term investment securities (Notes 4 and 17) 3,591,502 - 2,998,415 -
Investment securities accounted for using
the equity method (Notes 5 and 17) 520,171 402,465 434,272 336,004
Investment securities (Note 6) - 1,658,808 - 1,384,879
Property, plant and equipment, net of
accumulated depreciation of 7,445,356
million in 2003 and 6,415,241 million in
2002 (Notes 7, 8, 9 and 17) 17,842,898 16,745,238 14,896,392 13,979,995
Intangibles (Note 10) 1,862,057 1,678,110 1,554,564 1,400,993
Other assets (Note 11) 1,083,349 693,842 904,449 579,264
Deferred income tax assets (Note 19) 2,524,618 1,366,637 2,107,712 1,140,956
Total non-current assets 27,632,895 22,647,295 23,069,706 18,907,410
Other financial business assets (Note 12) 7,287,008 8,367,841 6,083,660 6,986,009
Total assets 54,252,677 46,125,688 $45,293,602 $38,508,673
(continued)
Korean won
(in millions)
Translation into
U. S. dollars (Note 2)
(in thousands)
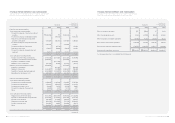
HYUNDAI MOTOR COMPANY AND SUBSIDIARIES
CONSOLIDATED BALANCE SHEETS (CONTINUED) AS OF DECEMBER 31, 2003 AND 2002
LIABILITIES AND SHAREHOLDERS’ EQUITY 2003 2002 2003 2002
Current liabilities:
Short-term borrowings (Note 13) 9,457,854 7,526,948 $7,896,021 $6,283,977
Current maturities of long-term debt, net of
unamortized discount of 5,163 million in
2003 and 657 million in 2002 (Note 14) 5,653,180 3,049,849 4,719,637 2,546,209
Trade notes and accounts payable 4,230,095 4,695,480 3,531,553 3,920,087
Accrued warranties and product liabilities 1,220,380 901,254 1,018,851 752,424
Accounts payable-other 2,356,840 2,741,462 1,967,641 2,288,748
Accrued expenses 858,883 314,674 717,050 262,710
Income tax payable 725,739 585,447 605,893 488,769
Other current liabilities 815,259 1,016,682 680,630 848,791
Total current liabilities 25,318,230 20,831,796 21,137,276 17,391,715
Long-term liabilities:
Long-term debt, net of current maturities
(Note 14) 6,432,270 8,010,263 5,370,070 6,687,480
Accrued severance benefits, net of National
Pension payments for employees of 104,223
million in 2003 and 123,960 million in
2002, and individual severance insurance
deposits of 1,641,600 million in 2003 and
1,513,268 million in 2002 (Note 2) 1,031,582 955,281 861,231 797,530
Accrued loss on valuation of derivatives
(Note 2) 209,285 17,053 174,724 14,237
Accrued warranties and product liabilities 3,391,690 2,401,220 2,831,600 2,004,692
Deferred income tax liabilities (Note 19) 911,537 124,295 761,009 103,769
Other long-term liabilities 703,381 334,966 587,228 279,651
Total long-term liabilities 12,679,745 11,843,078 10,585,862 9,887,359
Other financial business liabilities - 12,732 - 10,629
Total liabilities 37,997,975 32,687,606 $31,723,138 $27,289,703
Commitments and contingencies (Note 24)
(continued)
Korean won
(in millions)
Translation into
U. S. dollars (Note 2)
(in thousands)