Hyundai 2003 Annual Report Download - page 48
Download and view the complete annual report
Please find page 48 of the 2003 Hyundai annual report below. You can navigate through the pages in the report by either clicking on the pages listed below, or by using the keyword search tool below to find specific information within the annual report.-
 1
1 -
2
-
3
-
4
-
5
-
6
-
7
-
8
-
9
-
10
-
11
-
12
-
13
-
14
-
15
-
16
-
17
-
18
-
19
-
20
-
21
-
22
-
23
-
24
-
25
-
26
-
27
-
28
-
29
-
30
-
31
-
32
-
33
-
34
-
35
-
36
-
37
-
 38
38 -
 39
39 -
 40
40 -
 41
41 -
 42
42 -
 43
43 -
 44
44 -
 45
45 -
 46
46 -
 47
47 -
 48
48 -
 49
49 -
 50
50 -
 51
51 -
 52
52 -
 53
53 -
 54
54 -
 55
55 -
 56
56 -
 57
57 -
 58
58
 |
 |

93_Hyundai Motor Company Annual Report 2003 Hyundai Motor Company Annual Report 2003 _94
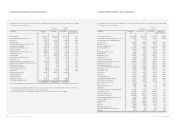
HYUNDAI MOTOR COMPANY AND SUBSIDIARIES HYUNDAI MOTOR COMPANY AND SUBSIDIARIES
2003 2002 2003 2002
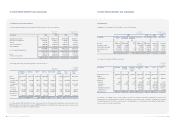
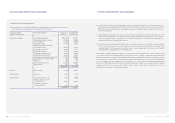
Salaries 1,728,168 1,636,321 $1,442,785 $1,366,105
Export related expenses 925,061 839,878 772,300 701,184
Sales promotion 2,320,814 2,159,849 1,937,564 1,803,180
Sales commission 403,840 405,419 337,151 338,470
Sales warranties 2,028,818 2,211,522 1,693,787 1,846,320
Taxes and dues 55,574 47,906 46,397 39,995
Communications 79,475 57,040 66,351 47,621
Utilities 46,065 41,350 38,458 34,522
Freight and warehousing 145,941 159,823 121,841 133,430
Rent 73,693 48,136 61,524 40,187
Travel 114,055 107,469 95,220 89,722
Service charges 539,698 345,069 450,574 288,086
Supplies 84,031 76,684 70,154 64,021
Research 478,197 313,865 399,229 262,035
Depreciation 219,658 180,301 183,385 150,527
Amortization 233,051 78,139 194,566 65,235
Provision for bad debt 1,532,102 598,448 1,279,097 499,623
Other 84,600 222,037 70,630 185,369
11,092,841 9,529,256 $9,261,013 $7,955,632
Korean won
(in millions)
U. S. dollars (Note 2)
(in thousands)
18. SELLING AND ADMINISTRATIVE EXPENSES
Selling and administrative expenses are as follows:
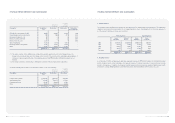
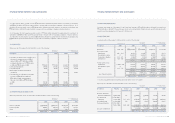
As of December 31, 2003, accumulated temporary differences of the Company and its subsidiaries amount to 4,287,892
million ($3,579,806 thousand) and net operating loss carry-forwards and tax exemption carry-forwards of subsidiaries amount
to 700,472 million ($584,799 thousand) and 135,998 million ($113,540 thousand), respectively. Some portion of the
temporary difference, net operating loss carry-forwards and tax exemption carry-forwards, which are more likely than not,
were not realized as deferred tax assets. Deferred tax assets was calculated using the expected tax rate (for 2004: 29.7%, from
2005 forward: 27.5%) with residual temporary differences. As of December 31, 2003 and 2002, deferred tax assets amount to
2,524,618 million ($2,107,712 thousand) and 1,366,637 million ($1,140,956 thousand), respectively and deferred tax liabilities
amount to 911,537 million ($761,009 thousand) and 124,295 million ($103,769 thousand), respectively.
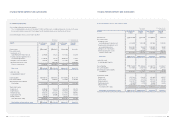
9. INCOME TAX EXPENSE AND DEFERRED INCOME TAX DEBITS (CREDITS)
Income tax expense in 2003 and 2002 consists of the following:
Description 2003 2002 2003 2002
Income tax currently payable 1,145,758 1,023,118 $956,552 $854,164
Changes in deferred income taxes due to:
Temporary differences (411,850) (247,882) (343,839) (206,948)
Tax loss carried forward (61,446) 95,899 (51,299) 80,063
Tax credit carried over (20,023) (6,159) (16,716) (5,142)
Deduction of capital surplus and
retained earnings - (480) - (401)
Excess of limitation on donation to
designated organization, others - 607 - 507
Changes in retained earnings
due to consolidation adjustments - (20,759) - (17,331)
(493,319) (178,774) (411,854) (149,252)
Income tax expense 652,439 844,344 $544,698 $704,912
Korean won
(in millions)
U. S. dollars (Note 2)
(in thousands)
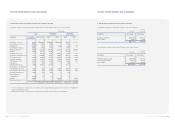
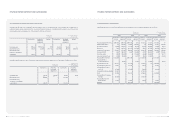
20. DIVIDENDS
The proposed dividends for 2003 are computed as follows:
Number of Dividend rate Korean won U.S. dollars
shares (in millions) (Note 2)
(in thousands)
Common shares, net of treasury shares 218,629,032 20% 218,629 $182,526
Preferred shares, net of treasury shares:
First and Third preferred shares 24,492,541 21% 25,717 21,470
Second preferred shares 37,571,005 22% 41,328 34,503
285,674 $238,499
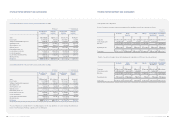
The proposed dividends for 2002 were computed as follows:
Number of Dividend rate Korean won U.S. dollars
shares (in millions) (Note 2)
(in thousands)
Common shares, net of treasury shares 218,083,132 17% 185,371 $154,760
Preferred shares, net of treasury shares:
First and Third preferred shares 24,492,541 18% 22,043 18,403
Second preferred shares 37,542,305 19% 35,665 29,775
243,079 $202,938
The proposed dividends for 2003 and 2002 were approved at the shareholders’ meeting being held on March 12, 2004 and
March 14, 2003, respectively.