Hyundai 2002 Annual Report Download - page 42
Download and view the complete annual report
Please find page 42 of the 2002 Hyundai annual report below. You can navigate through the pages in the report by either clicking on the pages listed below, or by using the keyword search tool below to find specific information within the annual report.-
 1
1 -
2
-
3
-
4
-
5
-
6
-
7
-
8
-
9
-
10
-
11
-
12
-
13
-
14
-
15
-
16
-
17
-
18
-
19
-
20
-
21
-
22
-
23
-
24
-
25
-
26
-
27
-
28
-
29
-
30
-
31
-
 32
32 -
 33
33 -
 34
34 -
 35
35 -
 36
36 -
 37
37 -
 38
38 -
 39
39 -
 40
40 -
 41
41 -
 42
42 -
 43
43 -
 44
44 -
 45
45 -
 46
46
 |
 |

HYUNDAI MOTOR COMPANY AND SUBSIDIARIES: Financial Statements 2002
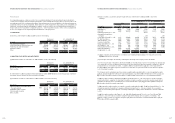
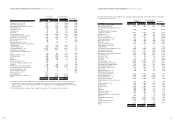
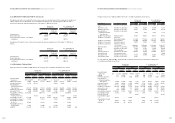
20. ELIMINATION OF UNREALIZED PROFITS AND LOSSES
Unrealized profits and losses resulting from intercompany sales are calculated based on the average gross margin rate of
selling companies and are eliminated in the consolidated financial statements. Unrealized profits related to sales of
inventories and property, plant and equipment as of December 31, 2002 are as follows:
Korean won U.S. dollars(Note 2)
(in millions) (in thousands)
Property, Property,
Plant and Plant and
Inventories Equipment Inventories Equipment
Upstream sales 3,152 1,042
$
2,626
$
868
Downstream sales 280,045 - 233,293 -
Downstream sales between consolidated
subsidiaries 230,651 - 192,145 -
Unrealized profits related to sales of inventories and property, plant and equipment as of December 31, 2001 are as
follows:
Korean won U.S. dollars(Note 2)
(in millions) (in thousands)
Property, Property,
Plant and Plant and
Inventories Equipment Inventories Equipment
Upstream sales 3,747 1,057
$
3,121
$
881
Downstream sales 244,815 990 203,945 825
Downstream sales between consolidated
subsidiaries 319,570 - 266,220 -
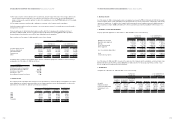
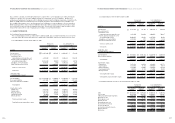
21. INTERCOMPANY TRANSACTIONS
Significant transactions in 2002 and 2001 between the Company and consolidated subsidiaries are as follows:
Korean won U. S. dollars (Note 2)
(in millions) (in thousands)
2002 2001 2002 2001
Company’s Company’s Company’s Company’s Company’s Company’s Company’s Company’s
income expenses income expenses income expenses income expenses
Hyundai Capital
Service Inc. 18,167 - 54,576 -
$
15,134
$
-
$
45,465
$
-
KEFICO Corporation 19,058 297,864 12,776 260,587 15,876 248,137 10,643 217,083
Hyundai Powertech 15,198 86,734 - - 12,661 72,254 - -
Hyundai Dymos
(formerly Korea Drive
Train System) 101,271 297,940 71,214 222,603 84,364 248,201 59,325 185,441
Kia Motors Corporation 870,662 443,576 809,373 457,928 725,310 369,523 674,253 381,480
Hyundai HYSCO 4,636 189,809 3,608 219,062 3,862 158,121 3,006 182,491
Hyundai Motor America 6,652,505 - 5,401,377 - 5,541,907 - 4,499,648 -
Hyundai America
Technical Center Inc. - 13,937 - 18,988 - 11,610 - 15,818
Hyundai Motor India 173,748 - 113,161 24,323 144,742 - 94,269 20,262
Hyundai Motor Japan Co. 33,182 - 17,927 - 27,642 - 14,934 -
Hyundai Motor Poland
Sp. Zo. O 65,652 - 32,428 - 54,692 - 27,014 -
Hyundai Machine Tool
Europe GmbH 15,053 - 18,806 - 12,540 - 15,666 -
HAOSVT 124,339 - 22,746 595 103,581 - 18,949 496
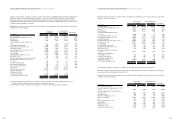
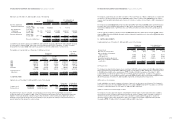
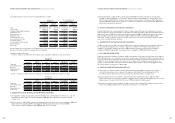
HYUNDAI MOTOR COMPANY AND SUBSIDIARIES: Financial Statements 2002
Significant transactions in 2002 and 2001 between the consolidated subsidiaries are as follows:
Korean won U.S. dollars(Note 2)
(in millions) (in thousands)
Subsidiaries Counterpart Subsidiaries 2002 2001 2002 2001
Hyundai Capital Service Kia Motors Corporation 6,485 17,654
$
5,402
$
14,707
Inc.
Autoever Co.,Ltd Kia Motors Corporation 19,442 10,501 16,196 8,748
KEFICO Corporation Kia Motors Corporation 49,113 42,146 40,914 35,110
Hyundai Dymos Kia Motors Corporation
(formerly Korea Drive 9,918 9,332 8,262 7,774
Train System)
Kia Motors Corporation Wia Corporation 99,123 80,621 82,575 67,162
Kia Motors Corporation KIA Motors
Deutschland GmbH 357,430 173,658 297,759 144,667
Kia Motors Corporation KIA Canada, Inc 283,940 276,689 236,538 230,497
Kia Motors Corporation Hyundai Powertech 10,018 16,025 8,346 13,350
Kia Motors Corporation KIA Motors America
Inc. and etc. 3,060,285 3,076,082 2,549,388 2,562,547
Wia Corporation Kia Motors Corporation 403,914 347,041 336,483 289,104
WISCO Kia Motors Corporation 13,732 15,413 11,440 12,840
WISCO WIA Corporation 21,166 15,708 17,632 13,086
Hyundai Powertech Kia Motors Corporation 150,031 40,229 124,984 33,513
Hyundai HYSCO Hyundai Motor India - 6,674 - 5,600
Hyundai HYSCO Kia Motors Corporation 83,417 94,986 69,491 79,129
Hyundai Motor India Kia Motors Corporation 22,895 - 19,073 -
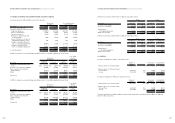
As of December 31, 2002 and 2001, significant balances related to the transactions between the Company and
consolidated subsidiaries are as follows:
Korean won U. S. dollars (Note 2)
(in millions) (in thousands)
2002 2001 2002 2001
Company’s Company’s Company’s Company’s Company’s Company’s Company’s Company’s
receivable payable receivable payable receivable payable receivable payable
Hyundai Capital
Service Inc. 572 7,023 886 3,643
$
477
$
5,851
$
738
$
3,035
ROTEM 251 14,784 - 5,198 209 12,316 - 4,330
KEFICO Corporation 471 41,196 1,690 34,402 392 34,319 1,408 28,659
Hyundai Dymos
(formerly Korea Drive
Train System 2,080 57,828 2,456 7,767 1,733 48,174 2,046 6,470
Hyundai Powertech 6,907 30,242 6,876 29,646 5,754 25,913 5,728 24,697
WIA Corporation 51,135 13,858 37,169 - 42,598 11,544 30,964 -
Kia Motors Corporation 124,266 106,006 77,476 97,268 103,520 88,309 64,542 81,030
Autoever Co., Ltd 31 26,001 214 23,475 26 21,660 178 19,556
Hyundai HYSCO 129 40,466 5 64,427 107 33,710 4 53,671
Hyundai Motor America 1,413,608 23,253 81,882 63,363 1,177,614 19,371 68,212 52,785
Hyundai Motor India 6,586 - 7,041 - 5,487 - 5,866 -
Hyundai Translead - - - 39,265 - - - 32,710
Hyundai Motor Japan
Co. 32,292 - 12,509 - 26,901 - 10,421 -
Hyundai Motor Poland
Sp. Zo. O 10,037 168 13,567 - 8,361 140 11,302 -
HAOSVT 66,460 10 46,578 - 55,365 8 38,802 -
82 83